Thursday, January 13, 2011

New Peer Reiviewed Paper Shows “Absence Of Correlation Between Temperature Changes … And CO2″

Via Watts Up With That and from Joe D’Aleo of ICECAP is this peer reviewed paper that demonstrated a better correlation of temperature with the PDO and Solar influences than via any increase in CO2.

Warming Trend: PDO And Solar Correlate Better Than CO2

daleo-cru-msu-co2.png

Joe wrote then:

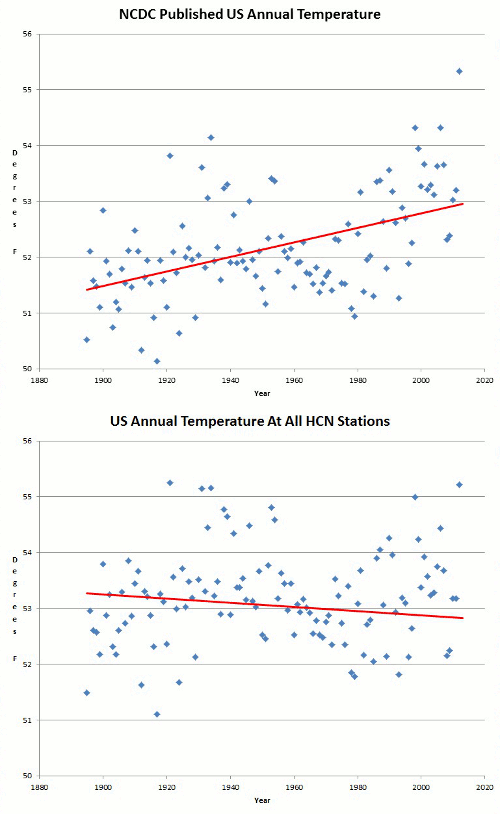
Clearly the US annual temperatures over the last century have correlated far better with cycles in the sun and oceans than carbon dioxide. The correlation with carbon dioxide seems to have vanished or even reversed in the last decade.

There’s a new paper by Paulo Cesar Soares in the International Journal of Geosciences supporting Joe’s idea, and it is full and open access. See link below.

Warming Power of CO2 and H2O: Correlations with Temperature Changes

Author: Paulo Cesar Soares

ABSTRACT

The dramatic and threatening environmental changes announced for the next decades are the result of models whose main drive factor of climatic changes is the increasing carbon dioxide in the atmosphere. Although taken as a premise, the hypothesis does not have verifiable consistence. The comparison of temperature changes and CO2 changes in the atmosphere is made for a large diversity of conditions, with the same data used to model climate changes. Correlation of historical series of data is the main approach. CO2 changes are closely related to temperature.

Warmer seasons or triennial phases are followed by an atmosphere that is rich in CO2, reflecting the gas solving or exsolving from water, and not photosynthesis activity. Interannual correlations between the variables are good. A weak dominance of temperature changes precedence, relative to CO2 changes, indicate that the main effect is the CO2 increase in the atmosphere due to temperature rising. Decreasing temperature is not followed by CO2 decrease, which indicates a different route for the CO2 capture by the oceans, not by gas re-absorption. Monthly changes have no correspondence as would be expected if the warming was an important absorption-radiation effect of the CO2 increase.

The anthropogenic wasting of fossil fuel CO2 to the atmosphere shows no relation with the temperature changes even in an annual basis. The absence of immediate relation between CO2 and temperature is evidence that rising its mix ratio in the atmosphere will not imply more absorption and time residence of energy over the Earth surface. This is explained because band absorption is nearly all done with historic CO2 values. Unlike CO2, water vapor in the atmosphere is rising in tune with temperature changes, even in a monthly scale. The rising energy absorption of vapor is reducing the outcoming long wave radiation window and amplifying warming regionally and in a different way around the globe.

From the conclusion:

Figure 21. Changes of specific humidity (vapor) in atmosphere compared to tropical and global temperature changes (vapor data from Tyndall Center)

Figure 22. Cause and effect of specific humidity in the atmosphere associated with temperature changes: correlation in monthly scale, compared to CO2 correlation, between 1983 and 2003. Temperature from tropical band; CO2 at Mauna Loa (CDIAC)

The main conclusion one arrives at the analysis is that CO2 has not a causal relation with global warming and it is not powerful enough to cause the historical changes in temperature that were observed. The main argument is the absence of immediate correlation between CO2 changes preceding temperature either for global or local changes. The greenhouse effect of the CO2 is very small compared to the water vapor because the absorbing effect is already realized with its historical values. So, the reduction of the outcoming long wave radiation window is not a consequence of current enrichment or even of a possible double ratio of CO2. The absence of correlation between temperature changes and the immense and variable volume of CO2 waste by fuel burning is explained by the weak power of additional carbon dioxide in the atmosphere to reduce the outcoming window of long wave radiation. This effect is well performed by atmosphere humidity due to known increase insolation and vapor content in atmosphere.

The role of vapor is reinforced when it is observed that the regions with a great difference between potential and actual specific humidity are the ones with high temperature increase, like continental areas in mid to high latitudes. The main implication is that temperature increase predictions based on CO2 driving models are not reliable.

If the warmer power of solar irradiation is the independent driver for decadal and multidecadal cycles, the expected changes in insolation and no increase in green- house power may imply the recurrence of multidecadal cool phase, recalling the years of the third quarter of past century, before a new warming wave. The last decade stable temperature seems to be the turning point.

Full Text (PDF, 1794KB) PP.102-112 DOI: 10.4236/ijg.2010.13014

New Peer Reviewed Study Shows Just How Bad Climate Models Are

Via Watts Up With That is a critique of a peer reviewed paper byAnagnostopoulos, G. G. , Koutsoyiannis, D. , Christofides, A. , Efstratiadis, A. and Mamassis, N.

One of the biggest, if not the biggest issues of climate science skepticism is the criticism of over-reliance on computer model projections to suggest future outcomes. In this paper, climate models were hindcast tested against actual surface observations, and found to be seriously lacking. Just have a look at Figure 12 (mean temperature -vs- models for the USA) from the paper, shown below:

Fig. 12. Various temperature time series spatially integrated over the USA (mean annual), at annual and 30-year scales. Click image for the complete graph.

The graph above shows temperature in the blue lines, and model runs in other colors. Not only are there no curve shape matches, temperature offsets are significant as well. In the study, they also looked at precipitation, which fared even worse in correlation. The bottom line: if the models do a poor job of hindcasting, why would they do any better in forecasting? This from the conclusion sums it up pretty well:

…we think that the most important question is not whether GCMs can produce credible estimates of future climate, but whether climate is at all predictable in deterministic terms.

Selected sections of the entire paper, from the Hydrological Sciences Journal is available online here as HTML, and as PDF ~1.3MB are given below:

A comparison of local and aggregated climate model outputs with observed data

Anagnostopoulos, G. G. , Koutsoyiannis, D. , Christofides, A. , Efstratiadis, A. and Mamassis, N. ‘A comparison of local and aggregated climate model outputs with observed data’, Hydrological Sciences Journal, 55:7, 1094 – 1110

Abstract

We compare the output of various climate models to temperature and precipitation observations at 55 points around the globe. We also spatially aggregate model output and observations over the contiguous USA using data from 70 stations, and we perform comparison at several temporal scales, including a climatic (30-year) scale. Besides confirming the findings of a previous assessment study that model projections at point scale are poor, results show that the spatially integrated projections are also poor.

Citation Anagnostopoulos, G. G., Koutsoyiannis, D., Christofides, A., Efstratiadis, A. & Mamassis, N. (2010) A comparison of local and aggregated climate model outputs with observed data. Hydrol. Sci. J. 55(7), 1094-1110.

INTRODUCTION

According to the Intergovernmental Panel on Climate Change (IPCC), global circulation models (GCM) are able to “reproduce features of the past climates and climate changes” (Randall et al., 2007, p. 601). Here we test whether this is indeed the case. We examine how well several model outputs fit measured temperature and rainfall in many stations around the globe. We also integrate measurements and model outputs over a large part of a continent, the contiguous USA (the USA excluding islands and Alaska), and examine the extent to which models can reproduce the past climate there. We will be referring to this as “comparison at a large scale”.

This paper is a continuation and expansion of Koutsoyiannis et al. (2008). The differences are that (a) Koutsoyiannis et al. (2008) had tested only eight points, whereas here we test 55 points for each variable; (b) we examine more variables in addition to mean temperature and precipitation; and (c) we compare at a large scale in addition to point scale. The comparison methodology is presented in the next section.

While the study of Koutsoyiannis et al. (2008) was not challenged by any formal discussion papers, or any other peer-reviewed papers, criticism appeared in science blogs (e.g. Schmidt, 2008). Similar criticism has been received by two reviewers of the first draft of this paper, hereinafter referred to as critics. In both cases, it was only our methodology that was challenged and not our results. Therefore, after presenting the methodology below, we include a section “Justification of the methodology”, in which we discuss all the critical comments, and explain why we disagree and why we think that our methodology is appropriate. Following that, we present the results and offer some concluding remarks.

Here’s the models they tested:

Comparison at a large scale

We collected long time series of temperature and precipitation for 70 stations in the USA (five were also used in the comparison at the point basis). Again the data were downloaded from the web site of the Royal Netherlands Meteorological Institute (http://climexp.knmi.nl). The stations were selected so that they are geographically distributed throughout the contiguous USA. We selected this region because of the good coverage of data series satisfying the criteria discussed above. The stations selected are shown in Fig. 2 and are listed by Anagnostopoulos

(2009, pp. 12-13).

THSJ_A_513518_O_XML_IMAGES\THSJ_A_513518_O_F0002g.jpg

Fig. 2. Stations selected for areal integration and their contribution areas (Thiessen polygons).

In order to produce an areal time series we used the method of Thiessen polygons (also known as Voronoi cells), which assigns weights to each point measurement that are proportional to the area of influence; the weights are the “Thiessen coefficients”. The Thiessen polygons for the selected stations of the USA are shown in Fig. 2.

The annual average temperature of the contiguous USA was initially computed as the weighted average of the mean annual temperature at each station, using the station’s Thiessen coefficient as weight. The weighted average elevation of the stations (computed by multiplying the elevation of each station with the Thiessen coefficient) is Hm = 668.7 m and the average elevation of the contiguous USA (computed as the weighted average of the elevation of each state, using the area of each state as weight) is H = 746.8 m. By plotting the average temperature of each station against elevation and fitting a straight line, we determined a temperature gradient θ = -0.0038°C/m, which implies a correction of the annual average areal temperature θ(H - Hm) = -0.3°C.

The annual average precipitation of the contiguous USA was calculated simply as the weighted sum of the total annual precipitation at each station, using the station’s Thiessen coefficient as weight, without any other correction, since no significant correlation could be determined between elevation and precipitation for the specific time series examined.

We verified the resulting areal time series using data from other organizations. Two organizations provide areal data for the USA: the National Oceanic and Atmospheric Administration (NOAA) and the National Aeronautics and Space Administration (NASA). Both organizations have modified the original data by making several adjustments and using homogenization methods. The time series of the two organizations have noticeable differences, probably because they used different processing methods. The reason for calculating our own areal time series is that we wanted to avoid any comparisons with modified data. As shown in Fig. 3, the temperature time series we calculated with the method described above are almost identical to the time series of NOAA, whereas in precipitation there is an almost constant difference of 40 mm per year.

THSJ_A_513518_O_XML_IMAGES\THSJ_A_513518_O_F0003g.jpg

Fig. 3. Comparison between areal (over the USA) time series of NOAA (downloaded from http://www.ncdc.noaa.gov/oa/climate/research/cag3/cag3.html) and areal time series derived through the Thiessen method; for (a) mean annual temperature (adjusted for elevation), and (b) annual precipitation.

Determining the areal time series from the climate model outputs is straightforward: we simply computed a weighted average of the time series of the grid points situated within the geographical boundaries of the contiguous USA. The influence area of each grid point is arectangle whose “vertical” (perpendicular to the equator) side is (ϕ2 - ϕ1)/2 and its “horizontal” side is proportional to cosϕ, where ϕ is the latitude of each grid point, and ϕ2 and ϕ1 are the latitudes of the adjacent “horizontal” grid lines. The weights used were thus cosϕ(ϕ2 - ϕ1); where grid latitudes are evenly spaced, the weights are simply cosϕ.

CONCLUSIONS AND DISCUSSION

It is claimed that GCMs provide credible quantitative estimates of future climate change, particularly at continental scales and above. Examining the local performance of the models at 55 points, we found that local projections do not correlate well with observed measurements. Furthermore, we found that the correlation at a large spatial scale, i.e. the contiguous USA, is worse than at the local scale.

However, we think that the most important question is not whether GCMs can produce credible estimates of future climate, but whether climate is at all predictable in deterministic terms. Several publications, a typical example being Rial et al. (2004), point out the difficulties that the climate system complexity introduces when we attempt to make predictions. “Complexity” in this context usually refers to the fact that there are many parts comprising the system and many interactions among these parts. This observation is correct, but we take it a step further. We think that it is not merely a matter of high dimensionality, and that it can be misleading to assume that the uncertainty can be reduced if we analyse its “sources” as nonlinearities, feedbacks, thresholds, etc., and attempt to establish causality relationships. Koutsoyiannis (2010) created a toy model with simple, fully-known, deterministic dynamics, and with only two degrees of freedom (i.e. internal state variables or dimensions); but it exhibits extremely uncertain behaviour at all scales, including trends, fluctuations, and other features similar to those displayed by the climate. It does so with a constant external forcing, which means that there is no causality relationship between its state and the forcing. The fact that climate has many orders of magnitude more degrees of freedom certainly perplexes the situation further, but in the end it may be irrelevant; for, in the end, we do not have a predictable system hidden behind many layers of uncertainty which could be removed to some extent, but, rather, we have a system that is uncertain at its heart.

Do we have something better than GCMs when it comes to establishing policies for the future? Our answer is yes: we have stochastic approaches, and what is needed is a paradigm shift. We need to recognize the fact that the uncertainty is intrinsic, and shift our attention from reducing the uncertainty towards quantifying the uncertainty (see also Koutsoyiannis et al., 2009a). Obviously, in such a paradigm shift, stochastic descriptions of hydroclimatic processes should incorporate what is known about the driving physical mechanisms of the processes. Despite a common misconception of stochastics as black-box approaches whose blind use of data disregard the system dynamics, several celebrated examples, including statistical thermophysics and the modelling of turbulence, emphasize the opposite, i.e. the fact that stochastics is an indispensable, advanced and powerful part of physics. Other simpler examples (e.g. Koutsoyiannis, 2010) indicate how known deterministic dynamics can be fully incorporated in a stochastic framework and reconciled with the unavoidable emergence of uncertainty in predictions.

New Peer Review Study Rebuts Schmidt Paper on Surface Temperature Measurements

Dr. Ross McKitrick has co authored a peer reviewed paper that demonstrates the likely contamination of surface temperature results used by Gavin Schmidt and the IPCC. He also explains the difficulties that scientists not in the hockey team have in getting papers published, seeing as those in the Hockey Team tried to "redefine what peer review literature is".
Via Climate Research News:

Meanwhile, Ross McKitrick writes:

NEW PAPER ON CONTAMINATED SURFACE TEMPERATURE DATA: In 2007 I published a paper with Pat Michaels showing evidence that CRU global surface temperature data used by the IPCC are likely contaminated due to socioeconomic development and variations in data quality. In 2009 Gavin Schmidt published a paper in the International Journal of Climatology claiming our results, as well as those of de Laat and Maurellis who independently found the same things we did, were spurious. My rebuttal, coauthored with Nicolas Nierenberg, has been accepted at The Journal of Economic and Social Measurement.

McKitrick, Ross R. and Nicolas Nierenberg (2010) Socioeconomic Patterns in Climate Data. Journal of Economic and Social Measurement, forthcoming.

The paper provides a complete and thorough refutation of Schmidt’s critique. Why JESM? First, because it is a journal that focuses on the critical evaluation of policy-relevant databases, and its editors and reviewers have considerable econometric depth, and this paper is fundamentally an application of econometrics to the evaluation of data quality. Second, we submitted the paper to the IJOC in April 2009, on the assumption that, having published Schmidt’s paper, they were interested in the topic. Evidently their interest only extends to analyses that support IPCC views. After 10 months we found out that IJOC was rejecting our paper on the basis of some inane referee reports to which Nico and I were not given a chance to reply. We did anyway, and if anyone thinks the rejection by IJOC amounts to a knock against our paper, please read our response letter for some perspective. Whether or not the IJOC editors read it, they refused to reconsider our paper. Interestingly, we learned from the Climategate release that Schmidt’s paper, which focuses on defending Phil Jones’ CRU data against its various critics, was sent by the IJOC Editors to be reviewed by Phil Jones of the CRU. As you can imagine his review was shallow and uncritical, but evidently impressed the editors of IJOC. They didn’t ask deLaat or me to supply a review, nor did they invite us to contribute a response. Every interaction I have had over the years with the IJOC has left me very unimpressed.”

Summary of McKitrick & Nierenberg (2010):

To generate a climate data set, temperature data collected at the Earth’s surface must be adjusted to remove non-climatic effects such as urbanization and measurement discontinuities. Some studies have shown that the post-1980 spatial pattern of temperature trends over land in prominent climate data sets is strongly correlated with the spatial pattern of socioeconomic development, implying that the adjustments are inadequate, leaving a residual warm bias. This evidence has been disputed on three grounds: spatial autocorrelation of the temperature field undermines significance of test results; counterfactual experiments using model generated data suggest such correlations have an innocuous interpretation; and different satellite covariates yield unstable results. Somewhat surprisingly, these claims have not been put into a coherent framework for the purpose of statistical testing. We combine economic and climatological data sets from various teams with trend estimates from global climate models and we use spatial regressions to test the competing hypotheses. Overall we find that the evidence for contamination of climatic data is robust across numerous data sets, it is not undermined by controlling for spatial autocorrelation, and the patterns are not explained by climate models. Consequently we conclude that important data products used for the analysis of climate change over global land surfaces may be contaminated with socioeconomic patterns related to urbanization and other socioeconomic processes.

New Peer Reviewed Study Rebuts Steig et al Study on Antarctic

In an earlier post on The Polar Ice Caps -Part 3 I referenced a study conducted by Professor Eric Stieg and others that reportedly showed massive warming over the majority of Antarctica despite much evidence to the contrary. Needless to say it captured the media's attention and was for the most part unquestioned by them with the exception of columnists like Christopher Booker of the U.K. Telegraph.

Now it seems there is another peer reviewed study into this same area and not surprisingly when not relying on an outcome to prove a theory, it had very different results:

Entitled Improved methods for PCA-based reconstructions: case study using the Steig et al. 2009 Antarctic temperature reconstruction its abstract can be viewed here. The following is some analysis of the new paper by Climate Research News:

Remember the Steig et al 2009 Nature paper? As Steve McIntyre points out at Climate Audit: “Like so many Team efforts, it applied a little-known statistical method, the properties of which were poorly known, to supposedly derive an important empirical result. In the case of Steig et al 2009, the key empirical claim was that strong Antarctic warming was not localized to the Antarctic Peninsula (a prominent antecedent position), but was also very pronounced in West Antarctic.”

Well, there is a new paper in press in the Journal of Climate:

Improved methods for PCA-based reconstructions: case study using the Steig et al. 2009 Antarctic temperature reconstruction by Ryan O’Donnell, Nicholas Lewis, Steve McIntyre, Jeff Condon

The abstract states:

A detailed analysis is presented of a recently published Antarctic temperature reconstruction that combines satellite and ground information using a regularized expectation-maximization algorithm. Though the general reconstruction concept has merit, it is susceptible to spurious results for both temperature trends and patterns. The deficiencies include: (a) improper calibration of satellite data; (b) improper determination of spatial structure during infilling; and (c) suboptimal determination of regularization parameters, particularly with respect to satellite principal component retention. We propose two methods to resolve these issues. One utilizes temporal relationships between the satellite and ground data; the other combines ground data with only the spatial component of the satellite data. Both improved methods yield similar results that disagree with the previous method in several aspects. Rather than finding warming concentrated in West Antarctica, we find warming over the period of 1957–2006 to be concentrated in the Peninsula (≈0.35°C decade−1). We also show average trends for the continent, East Antarctica, and West Antarctica that are half or less than that found using the unimproved method. Notably, though we find warming in West Antarctica to be smaller in magnitude, we find that statistically significant warming extends at least as far as Marie Byrd Land. We also find differences in the seasonal patterns of temperature change, with winter and fall showing the largest differences and spring and summer showing negligible differences outside of the Peninsula.

Another analysis was provided by Anthony Watts at Watts Up With That:


In a blow to the Real Climate “hockey team” one team member’s paper, Steig et al Nature, Jan 22, 2009 (seen above) has been shown lacking. Once appropriate statistical procedures were applied, the real data spoke clearly, and it was done in a peer reviewed paper by skeptics. Jeff Condon of the Air Vent writes via email that he and co-authors, Ryan O’Donnell, Nicholas Lewis, and Steve McIntyre have succeeded in getting a paper accepted into the prestigious Journal of Climate and asked me to re-post the notice here.

The review process was difficult, with one reviewer getting difficult on submitted comments

[and subsequent rebuttal comments from authors ] that became longer than the submitted paper, 88 pages, 10 times the length of the paper they submitted! I commend them for their patience in wading through such formidable bloviation. Anyone want to bet that reviewer was a “team” member?

As WUWT covered in the past, these authors have demonstrated clearly that the warming is mostly in the Antarctic Peninsula. Steig et al’s Mannian PCA math methods had smeared that warming over most of the entire continent, creating a false impression.

WUWT visitors may want to read this primer which explains how this happens. But most

importantly, have a look at the side by side comparison maps below. Congratulations to Jeff, Ryan, Nick, and Steve! – Anthony

Jeff writes:

After ten months of reviews and rewrites we have successfully published an improved version of Steig et al. 2009. While we cannot publish the paper here, we can discuss the detail. Personally I’ve never seen so much work put into a single paper as Ryan did and it’s wonderful to see it come to a successful conclusion. This is the initial post on the subject, in the coming weeks there will be more to follow.

Guest post by lead author Ryan O’Donnel.

——–

DOING IT OURSELVES. . . a tongue-in-cheek reference to the RC post here:

Improved methods for PCA-based reconstructions: case study using the Steig et al. (2009) Antarctic temperature reconstruction

(Accepted 11/30/10, Journal of Climate)

Ryan O’Donnell Nicholas Lewis Steve McIntyre Jeff Condon

Abstract

A detailed analysis is presented of a recently published Antarctic temperature reconstruction
that combines satellite and ground information using a regularized expectation-maximization
algorithm. Though the general reconstruction concept has merit, it is susceptible to spurious
results for both temperature trends and patterns. The deficiencies include: (a) improper
calibration of satellite data; (b) improper determination of spatial structure during infilling;
and (c) suboptimal determination of regularization parameters, particularly with respect to
satellite principal component retention. We propose two methods to resolve these issues. One
utilizes temporal relationships between the satellite and ground data; the other combines
ground data with only the spatial component of the satellite data. Both improved methods
yield similar results that disagree with the previous method in several aspects. Rather than
finding warming concentrated in West Antarctica, we find warming over the period of
1957-2006 to be concentrated in the Peninsula (≈0.35oC decade-1). We also show average
trends for the continent, East Antarctica, and West Antarctica that are half or less than that
found using the unimproved method. Notably, though we find warming in West Antarctica to
be smaller in magnitude, we find that statistically significant warming extends at least as far
as Marie Byrd Land. We also find differences in the seasonal patterns of temperature change,
with winter and fall showing the largest differences and spring and summer showing negligible
differences outside of the Peninsula.

Region

RLS C/Dec

E-W C/Dec

S09 C/Dec

Continent

0.06 ± 0.08

0.04 ± 0.06

0.12 ± 0.09

East Antarctica

0.03 ± 0.09

0.02 ± 0.07

0.10 ± 0.10

West Antarctica

0.10 ± 0.09

0.06 ± 0.07

0.20 ± 0.09

Peninsula

0.35 ± 0.11

0.32 ± 0.09

0.13 ± 0.05

Copyright © 2010 American Meteorological Association

(early online release to be available on or around Dec. 7th)

Temperature trend Deg C/Decade .

Some of you remember that we intended to submit the analysis of the Steig Antarctic reconstruction for publication. That was quite some time ago . . . and then you heard nothing. We did, indeed, submit a paper to Journal of Climate in February. The review process unfortunately took longer than expected, primarily due to one reviewer in particular. The total number of pages dedicated by that reviewer alone – and our subsequent responses – was 88 single-spaced pages, or more than 10 times the length of the paper. Another contributor to the length of time from submission to acceptance was a hardware upgrade to the AMS servers that went horribly wrong, heaping a load of extra work on the Journal of Climate editorial staff.

With that being said, I am quite satisfied that the review process was fair and equitable, although I do believe excessive deference was paid to this one particular reviewer at the beginning of the process. While the other two reviews were positive (and contained many good suggestions for improvement of the manuscript), the other review was quite negative. As the situation progressed, however, the editor at Journal of Climate – Dr. Anthony Broccoli – added a fourth reviewer to obtain another opinion, which was also positive. My feeling is that Dr. Broccoli did a commendable job of sorting through a series of lengthy reviews and replies in order to ensure that the decision made was the correct one.

The results in the paper are generally similar to the in-process analysis that was posted at CA and here prior to the submission. Overall, we find that the Steig reconstruction overestimated the continental trends and underestimated the Peninsula – though our analysis found that the trend in West Antarctica was, indeed, statistically significant. I would hope that our paper is not seen as a repudiation of Steig’s results, but rather as an improvement.

In my opinion, the Steig reconstruction was quite clever, and the general concept was sound. A few of the choices made during implementation were incorrect; a few were suboptimal. Importantly, if those are corrected, some of the results change. Also importantly, some do not. Hopefully some of the cautions outlined in our paper are incorporated into other, future work. Time will tell!

Monday, October 11, 2010

A Very Important Letter

In early October 2010 Harold Lewis (Emeritus Professor of Physics at the University of California, Santa Barbara) released a letter of resignation to Curtis G. Callan Jr, Princeton University, President of the American Physical Society.

This letter is of great importance because not only does a long standing member of the APS resign because of what he says is "the greatest and most successful pseudoscientific fraud I have seen in my long life", referring to global warming and the APS's unquestioning acceptance of it, but how they and in particular Callan Jr have stifled any debate on the issue in the most unscientific manner.

Anthony Watts has described this letter as:

This is an important moment in science history. I would describe it as a letter on the scale of Martin Luther, nailing his 95 theses to the Wittenburg church door. It is worthy of repeating this letter in entirety on every blog that discusses science.

Here is the letter (my emphasis added):

Dear Curt:
When I first joined the American Physical Society sixty-seven years ago it was much smaller, much gentler, and as yet uncorrupted by the money flood (a threat against which Dwight Eisenhower warned a half-century ago). Indeed, the choice of physics as a profession was then a guarantor of a life of poverty and abstinence—it was World War II that changed all that. The prospect of worldly gain drove few physicists. As recently as thirty-five years ago, when I chaired the first APS study of a contentious social/scientific issue, The Reactor Safety Study, though there were zealots aplenty on the outside there was no hint of inordinate pressure on us as physicists. We were therefore able to produce what I believe was and is an honest appraisal of the situation at that time. We were further enabled by the presence of an oversight committee consisting of Pief Panofsky, Vicki Weisskopf, and Hans Bethe, all towering physicists beyond reproach. I was proud of what we did in a charged atmosphere. In the end the oversight committee, in its report to the APS President, noted the complete independence in which we did the job, and predicted that the report would be attacked from both sides. What greater tribute could there be?

How different it is now. The giants no longer walk the earth, and the money flood has become the raison d’être of much physics research, the vital sustenance of much more, and it provides the support for untold numbers of professional jobs. For reasons that will soon become clear my former pride at being an APS Fellow all these years has been turned into shame, and I am forced, with no pleasure at all, to offer you my resignation from the Society.

It is of course, the global warming scam, with the (literally) trillions of dollars driving it, that has corrupted so many scientists, and has carried APS before it like a rogue wave. It is the greatest and most successful pseudoscientific fraud I have seen in my long life as a physicist. Anyone who has the faintest doubt that this is so should force himself to read the ClimateGate documents, which lay it bare. (Montford’s book organizes the facts very well.) I don’t believe that any real physicist, nay scientist, can read that stuff without revulsion. I would almost make that revulsion a definition of the word scientist.

So what has the APS, as an organization, done in the face of this challenge? It has accepted the corruption as the norm, and gone along with it. For example:

1. About a year ago a few of us sent an e-mail on the subject to a fraction of the membership. APS ignored the issues, but the then President immediately launched a hostile investigation of where we got the e-mail addresses. In its better days, APS used to encourage discussion of important issues, and indeed the Constitution cites that as its principal purpose. No more. Everything that has been done in the last year has been designed to silence debate

2. The appallingly tendentious APS statement on Climate Change was apparently written in a hurry by a few people over lunch, and is certainly not representative of the talents of APS members as I have long known them. So a few of us petitioned the Council to reconsider it. One of the outstanding marks of (in)distinction in the Statement was the poison word incontrovertible, which describes few items in physics, certainly not this one. In response APS appointed a secret committee that never met, never troubled to speak to any skeptics, yet endorsed the Statement in its entirety. (They did admit that the tone was a bit strong, but amazingly kept the poison word incontrovertible to describe the evidence, a position supported by no one.) In the end, the Council kept the original statement, word for word, but approved a far longer “explanatory” screed, admitting that there were uncertainties, but brushing them aside to give blanket approval to the original. The original Statement, which still stands as the APS position, also contains what I consider pompous and asinine advice to all world governments, as if the APS were master of the universe. It is not, and I am embarrassed that our leaders seem to think it is. This is not fun and games, these are serious matters involving vast fractions of our national substance, and the reputation of the Society as a scientific society is at stake.

3. In the interim the ClimateGate scandal broke into the news, and the machinations of the principal alarmists were revealed to the world. It was a fraud on a scale I have never seen, and I lack the words to describe its enormity. Effect on the APS position: none. None at all. This is not science; other forces are at work.

4. So a few of us tried to bring science into the act(that is, after all, the alleged and historic purpose of APS), and collected the necessary 200+ signatures to bring to the Council a proposal for a Topical Group on Climate Science, thinking that open discussion of the scientific issues, in the best tradition of physics, would be beneficial to all, and also a contribution to the nation. I might note that it was not easy to collect the signatures, since you denied us the use of the APS membership list. We conformed in every way with the requirements of the APS Constitution, and described in great detail what we had in mind—simply to bring the subject into the open.

5. To our amazement, Constitution be damned, you declined to accept our petition, but instead used your own control of the mailing list to run a poll on the members’ interest in a TG on Climate and the Environment. You did ask the members if they would sign a petition to form a TG on your yet-to-be-defined subject, but provided no petition, and got lots of affirmative responses. (If you had asked about sex you would have gotten more expressions of interest.) There was of course no such petition or proposal, and you have now dropped the Environment part, so the whole matter is moot. (Any lawyer will tell you that you cannot collect signatures on a vague petition, and then fill in whatever you like.) The entire purpose of this exercise was to avoid your constitutional responsibility to take our petition to the Council.

6. As of now you have formed still another secret and stacked committee to organize your own TG, simply ignoring our lawful petition.

APS management has gamed the problem from the beginning, to suppress serious conversation about the merits of the climate change claims. Do you wonder that I have lost confidence in the organization?

I do feel the need to add one note, and this is conjecture, since it is always risky to discuss other people’s motives. This scheming at APS HQ is so bizarre that there cannot be a simple explanation for it. Some have held that the physicists of today are not as smart as they used to be, but I don’t think that is an issue. I think it is the money, exactly what Eisenhower warned about a half-century ago. There are indeed trillions of dollars involved, to say nothing of the fame and glory (and frequent trips to exotic islands) that go with being a member of the club. Your own Physics Department (of which you are chairman) would lose millions a year if the global warming bubble burst. When Penn State absolved Mike Mann of wrongdoing, and the University of East Anglia did the same for Phil Jones, they cannot have been unaware of the financial penalty for doing otherwise. As the old saying goes, you don’t have to be a weatherman to know which way the wind is blowing. Since I am no philosopher, I’m not going to explore at just which point enlightened self-interest crosses the line into corruption, but a careful reading of the ClimateGate releases makes it clear that this is not an academic question.

I want no part of it, so please accept my resignation. APS no longer represents me, but I hope we are still friends.
Hal

Harold Lewis is Emeritus Professor of Physics, University of California, Santa Barbara, former Chairman; Former member Defense Science Board, chmn of Technology panel; Chairman DSB study on Nuclear Winter; Former member Advisory Committee on Reactor Safeguards; Former member, President’s Nuclear Safety Oversight Committee; Chairman APS study on Nuclear Reactor Safety Chairman Risk Assessment Review Group; Co-founder and former Chairman of JASON; Former member USAF Scientific Advisory Board; Served in US Navy in WW II; books: Technological Risk (about, surprise, technological risk) and Why Flip a Coin (about decision making)

Once again we see an noted scientific organisation being accused by one of its own members of becoming a prostitute to the glut of funding coming from government and environmental organisations and corrupting it's principles to the core. The long term damage of this is yet to be fully measured, but one can only assume that for some the damage they are doing to their reputations will be irreparable.

Sunday, October 10, 2010

Stinks Of Desperation By The Alarmists.

In my previous post entitled Failing To Convince, Climate Activists Threaten Instead, I examined how the pro climate change activists and extremists had ramped up their use of direct threats to those who had dared to challenge their position. At the end of September 2010 a UK organisation called 10:10 released a movie to YouTube that depicted people who failed to instantly sign up to their campaign of reducing carbon emissions by 10% being exploded and their detritus being splattered all over those believers who stood near them (presumably as a warning never to disagree again or face the same fate). I will link to a copy of the video here, however, I do so with this warning: This film contains scenes that some viewers may find distressing. Not suitable for children


After its released10:10 released the following statement.

Sorry.
Today we put up a mini-movie about 10:10 and climate change called 'No Pressure'.

With climate change becoming increasingly threatening, and decreasingly talked about in the media, we wanted to find a way to bring this critical issue back into the headlines whilst making people laugh. We were therefore delighted when Britain's leading comedy writer, Richard Curtis - writer of Blackadder, Four Weddings, Notting Hill and many others – agreed to write a short film for the 10:10 campaign. Many people found the resulting film extremely funny, but unfortunately some didn't and we sincerely apologise to anybody we have offended.

As a result of these concerns we've taken it off our website.

We'd like to thank the 50+ film professionals and 40+ actors and extras and who gave their time and equipment to the film for free. We greatly value your contributions and the tremendous enthusiasm and professionalism you brought to the project.

At 10:10 we're all about trying new and creative ways of getting people to take action on climate change. Unfortunately in this instance we missed the mark. Oh well, we live and learn.

Onwards and upwards,

Eugenie, Franny, Daniel, Lizzie and the whole 10:10 team

But 10:10 are not alone in their use of controversial images. This poster is from ACT Responsible, (a Left-wing advertising executive group) used this for a Cannes conference:


And this video designed to scare children was used to open the Copenhagen conference in 2009:


In another act of desperation of different kind, is the Climate Change Committee put together by the Gillard Government of Australia and their new coalition partners The Greens. As Herald Sun Columnist Andrew Bolt reports in his article Gillard rigs her warming “consensus”:

The fix is in, and shame on any commentator who falls for this childish spin:

THE Australian Greens have secured a deputy chair position on a new parliamentary climate change committee, Prime Minister Julia Gillard has announced.

The committee will receive independent advice from four experts - Ross Garnaut, Will Steffen, Rod Sims and Patricia Faulkner.

Ms Gillard will chair the committee while Climate Change Minister Greg Combet and Greens climate spokeswomen Christine Milne will serve as co-deputy chairs.

Ms Gillard said the committee would start from the position that a carbon price was required to reduce pollution and encourage investment in low-emission technologies.

Note already that the committee skips what should be the start of any discussion. As in: is a carbon price actually worth the pain? Will cutting our emissions actually achieve anything? Is a rise in global temperatures actually good for us? Isn’t it suicidal to slash our tiny emissions before the rest of the world - and especially the biggest emitters - agree to do likewise?

So right away this committee is fundamentally rigged to dodge debate and produce the “right” result. What’s sold by Gillard as an exercise to achieve “community consensus” is a con - this is the consensus you reach simply by excluding everyone who doesn’t agree with you. In fact, Gillard today made that explicit:

“Parliamentary members of the committee will be drawn from those who are committed to tackling climate change and who acknowledge that effectively reducing carbon pollution by 2020 will require a carbon price,” Ms Gillard said.

This is why the Coalition will not be taking up of the offer of two seats on the committee, which will be stacked instead by ideologues, including Greens leader Bob Brown:

There will also be two Greens and representation from the independent MPs. Independent Tony Windsor already has indicated his willingness to be a member of the committee.

Another con. On the committee’s agenda will be the carbon “levy” - actually tax - that Gillard repeatedly ruled out before the election, when there were nervous voters to fool:

The committee will consider mechanisms for introducing a carbon price, including a broad-based emissions trading scheme, carbon levy, or a hybrid of both.

Contrast that to this solemn promise of just six weeks ago:

There will be no carbon tax under the government I lead.

A carbon tax is actually a demand of the Greens, which now seems in charge of Labor’s global warming agenda. After all, Ross Garnaut had already done an extensive report for the then Rudd Government on exactly these questions, among others, and settled on an emissions trading scheme. Holding yet another inquiry just buys Labor more time for further delay, but also offers the Greens a prize - the hope of getting something even tougher and more damaging to our economy. Note that this committee aims to produce a “consensus” among its members (two of them Greens) that will actually form the Government policy.

But let’s get to the remaining deceit here. The four “independent experts” appointed by Gillard to advise the committee include people who are either not expert (in global warming policies, at least) or not independent.

Take Patricia Faulkner, who has no expertise in global warming policies at all and seems to have been chosen instead for her Leftism, social activism and bureaucratic skills - all the hallmarks of a classic apparatchik:

Patricia Faulkner has had an extensive career covering both the public and private sectors. She is currently the chair of the Australian Social Inclusion Board and the Chair of Jesuit Social Services. Jesuit Social Services is a small welfare based organisation that looks after people at the margins of society. She is also a Chair and Member of a range of health care and government advisory services boards, including the Federal Government Health and Hospitals Infrastructure Fund; and, the Council of Australian Governments Reform Council. She has spent 10 of the last 20 years as a partner with KPMG leading both their health and social policy sectors.

Then there’s the alarmist Will Steffen, who is indeed a climate scientist, but not one independent of this Government;

Professor Will Steffen is Executive Director of the ANU Climate Change Institute at the Australian National University (ANU), Canberra, and is also Science Adviser to the federal Department of Climate Change and Energy Efficiency.

Add Treasurer Wayne Swan to the committee, and the Government’s global warming policy is being decided (so far) by three Labor ministers, two Greens and an independent who knows little about global warming but is sure we must Do Something. And the six of them will be guided by four experts who turn out to be an alarmist scientist, a welfare activist, a big business representative and an alarmist economist.

Be scared.

This committee is little better than a propaganda outfit, designed to sell a “solution” already agreed upon in the broad - and which in detail may break one of Gilllard’s most solemn election promises. The “community consensus” it pretends to be developing is no more than a fix and a fraud.

UPDATE

Need more evidence of deceit and broken promises?

Julia Gillard, September 9. on her deal with the independents:

Indeed, this process, born of parliamentary deadlock, has resulted in more openness, transparency and reform in how we conduct our Parliament and the business of government than at any other time on modern Australian politics. Throughout this process of forming a new government we’ve been open with the Australian people. To quote Rob Oakeshott, sunshine is the best disinfectant, and we’ve agreed to far-reaching reforms that make me as Prime Minister and our government and how it functions more accountable to the Australian people. So, let’s draw back the curtains and let the sun shine in; let our parliament be more open than it ever was before. That’s real reform, and that’s the direct result of the election.

Julia Gillard, September 27, on her deal with the Greens for this climate committee:

The Committee will ensure its deliberations and papers remain confidential to the Committee and the Cabinet until a final position is agreed or all parties to the Committee agree otherwise.

Yet when other non Green Senators express interest in joining this Labor/Green committee, this was the result (again via Andrew Bolt):

The Leninism of the Greens is revealed - and their power over Gillard, too:

THERE was no room for Nick Xenophon on the government’s multi-party climate change committee...

Climate Change Minister Greg Combet ... said the committee, chaired by Julia Gillard, was “small and tightly focused” and there was no room for anyone else, even though the Coalition had refused to fill two seats set aside for it…

Senator Xenophon said he was bitterly disappointed that despite writing and making representations to the Prime Minister and Mr Combet requesting a seat, he was excluded from the committee.

Sources close to Senator Xenophon said at least two Labor Party figures had told him “the Greens vetoed his presence”.

“Christine Milne was fingered as the one who insisted Nick not be on the committee,” a well-placed source said.

A spokesman for Senator Milne yesterday said the claim was “untrue”. South Australian Greens senator Sarah Hanson-Young said there was “no space available” for Senator Xenophon on the committee. “The committee decides that, and at this stage he’s not on there.”

Wasn’t this a committee to build “consensus” on global warming policies? Not only does it exclude those who disagree with the Greens position that we must put a price on carbon dioxide emissions, but now it’s excluding those who might challenge Greens power, too.

And this (again via Andrew Bolt) :

I’d thought she’d broken her ludicrous promise already, days after the election, but consider it really broken now:

PRIME Minister Julia Gillard has ditched her election policy of a climate change citizens’ assembly.

The excuse?

“I thought it was important that we harness community members to rebuild a broad general public consensus on how to tackle climate change, how to price carbon,’’ she said.

“There is not one way of doing that. There is not one way of harnessing and involving community members. Obviously the multi-party climate change committee today is looking at going to work through ways of doing that.’’

Actually, there is one importance difference between the deservedly derided Citizens’ Assembly and this climate change committee that Gillard claims will do the same job of persuasion. The citizens’ assembly was intended to get 150 uninformed people holding different beliefs on global warming to come to a “consensus”. The climate change committee is intended to get half a dozen uninformed Labor, Greens and independent MPs all holding the same belief on global warming to come to a “consensus”.

Somehow the citizens assembly seemed to have more integrity to it.

It all stinks of desperation from those that committed themselves to a course of action, yet have failed to convince the public that theirs is the right course of action. So instead they use either threats, violence or stacked committees to bluff, cagoule or simply scare the public to their view point. The question must always be asked, if the science was settled and so very convincing, why is there the need for all of this other stuff. Surely presenting the undeniable facts would be enough and would leave anyone denying them looking foolish. Yet they haven't been able to do that so now they resort to type.