



CERN Experiment Confirms Cosmic Rays Influence Climate Change.
by Nigel Calder
Long-anticipated results of the CLOUD experiment at CERN in Geneva appear in tomorrow’s issue of the journal Nature (25 August). The Director General of CERN stirred controversy last month, by saying that the CLOUD team’s report should be politically correct about climate change (see my 17 July post below). The implication was that they should on no account endorse the Danish heresy – Henrik Svensmark’s hypothesis that most of the global warming of the 20th Century can be explained by the reduction in cosmic rays due to livelier solar activity, resulting in less low cloud cover and warmer surface temperatures.
Willy-nilly the results speak for themselves, and it’s no wonder the Director General was fretful.
Jasper Kirkby of CERN and his 62 co-authors, from 17 institutes in Europe and the USA, announce big effects of pions from an accelerator, which simulate the cosmic rays and ionize the air in the experimental chamber. The pions strongly promote the formation of clusters of sulphuric acid and water molecules – aerosols of the kind that may grow into cloud condensation nuclei on which cloud droplets form. What’s more, there’s a very important clarification of the chemistry involved.
A breach of etiquette
My interest in CLOUD goes back nearly 14 years, to a lecture I gave at CERN about Svensmark’s discovery of the link between cosmic rays and cloudiness. It piqued Kirkby’s curiosity, and both Svensmark and I were among those who helped him to prepare his proposal for CLOUD.
By an unpleasant irony, the only Svensmark contribution acknowledged in theNature report is the 1997 paper (Svensmark and Friis-Christensen) on which I based my CERN lecture. There’s no mention of the successful experiments in ion chemistry and molecular cluster formation by the Danish team in Copenhagen, Boulby and latterly in Aarhus where they beat CLOUD to the first results obtained using a particle beam (instead of gamma rays and natural cosmic rays) to ionize the air in the experimental chamber – see http://calderup.wordpress.com/2011/05/17/accelerator-results-on-cloud-nucleation-2/
What will historians of science make of this breach of scientific etiquette? That Kirkby was cross because Svensmark, losing patience with the long delay in getting approval and funding for CLOUD, took matters into his own hands? Or because Svensmark’s candour about cosmic rays casting doubt on catastrophic man-made global warming frightened the national funding agencies? Or was Kirkby simply doing his best (despite the results) to obey his Director General by slighting all things Danish?
Personal rivalries aside, the important question is what the new CLOUD paper means for the Svensmark hypothesis. Pick your way through the cautious prose and you’ll find this:
“Ion-induced nucleation [cosmic ray action] will manifest itself as a steady production of new particles [molecular clusters] that is difficult to isolate in atmospheric observations because of other sources of variability but is nevertheless taking place and could be quite large when averaged globally over the troposphere [the lower atmosphere].”
It’s so transparently favourable to what the Danes have said all along that I’m surprised the warmists’ house magazine Nature is able to publish it, even omitting the telltale graph shown at the start of this post. Added to the already favourable Danish experimental findings, the more detailed CERN result is excellent. Thanks a million, Jasper.
Enlightening chemistry
And in friendlier times we’d be sharing champagne for a fine discovery with CLOUD, that traces of ammonia can increase the production of the sulphuric clusters a thousandfold. It’s highlighted in the report’s title: “Role of sulphuric acid, ammonia and galactic cosmic rays in atmospheric aerosol nucleation” and it was made possible by the more elaborate chemical analysis in the big-team set-up in Geneva. In essence, the ammonia helps to stabilize the molecular clusters.
Although not saying it openly, the CLOUD team implies a put-down for the Danes with this result, repeatedly declaring that without ammonia there’d be little cluster production at low altitudes. But although the Aarhus experimenters did indeed assume the simpler reaction (H2SO4 + H2O), differing results in successive experimental runs made them suspect that varying amounts of trace impurities were present in the air cylinders used to fill their chamber. Now it looks as if a key impurity may have been ammonia. But some members of the CLOUD consortium also favoured (H2SO4 + H2O) and early runs in Geneva used no intentional ammonia. So they’ve little reason to scoff.
In any case, whether the basic chemistry is (H2SO4 + H2O) or (H2SO4 + H2O + NH3) is an academic rather than a practical point. There are always traces of ammonia in the real air, and according to the CLOUD report you need only one molecule in 30 billion. If that helps to oil Svensmark’s climatic motor, it’s good to know, but it calls for no apologies and alters the climatic implications not a jot.
 The experiment’s logo. The acronym “Cosmics Leaving Outdoor Droplets” always implied strong interest in Svensmark’s hypothesis. And the roles of the Galaxy and the Sun are acknowledged.
Technically, CLOUD is a welcome advance on the Danish experiments. Not only is the chemistry wider ranging but molecular clusters as small as 1.7 nanometres in diameter are detectable, compared with 4 nm in Denmark. And the set-up enables the scientists to study the ion chemistry at lower temperatures, corresponding to increasing altitudes in the atmosphere. Cluster production soars as the temperature goes down, until “almost every negative ion gives rise to a new particle” [i.e. molecular cluster]. The lowest temperature reported in the paper is -25 oC. That corresponds to an altitude of 6000 metres, so unless you wish to visualize a rain of cloud-seeding aerosols from on high, it’s not very relevant to Svensmark’s interest in the lowest 3000 metres.
How the warmists built their dam
Shifting from my insider’s perspective on the CLOUD experiment, to see it on the broader canvas of the politicized climate science of the early 21st Century, the chief reaction becomes a weary sigh of relief. Although they never said so, the High Priests of the Inconvenient Truth – in such temples as NASA-GISS, Penn State and the University of East Anglia – always knew that Svensmark’s cosmic ray hypothesis was the principal threat to their sketchy and poorly modelled notions of self-amplifying action of greenhouse gases.
In telling how the obviously large influences of the Sun in previous centuries and millennia could be explained, and in applying the same mechanism to the 20th warming, Svensmark put the alarmist predictions at risk – and with them the billions of dollars flowing from anxious governments into the global warming enterprise.
For the dam that was meant to ward off a growing stream of discoveries coming from the spring in Copenhagen, the foundation was laid on the day after the Danes first announced the link between cosmic rays and clouds at a space conference in Birmingham, England, in 1996. “Scientifically extremely naïve and irresponsible,”Bert Bolin declared, as Chairman of the Intergovernmental Panel on Climate Change.
As several journalists misbehaved by reporting the story from Birmingham, the top priority was to tame the media. The first courses of masonry ensured that anything that Svensmark and his colleagues might say would be ignored or, failing that, be promptly rubbished by a warmist scientist. Posh papers like The Times of London and the New York Times, and posh TV channels like the BBC’s, readily fell into line. Enthusiastically warmist magazines like New Scientist and Scientific American needed no coaching.
Similarly the journals Nature and Science, which in my youth prided themselves on reports that challenged prevailing paradigms, gladly provided cement for higher masonry, to hold the wicked hypothesis in check at the scientific level. Starve Svensmark of funding. Reject his scientific papers but give free rein to anyone who criticizes him. Trivialize the findings in the Holy Writ of the Intergovernmental Panel on Climate Change. None of this is paranoia on my part, but a matter of close personal observation since 1996.
“It’s the Sun, stupid!” The story isn’t really about a bunch of naughty Danish physicists. They are just spokesmen for the most luminous agent of climate change. As the Sun was what the warmists really wanted to tame with their dam, they couldn’t do it. And coming to the Danes’ aid, by briefly blasting away many cosmic rays with great puffs of gas, the Sun enabled the team to trace in detail the consequent reduction in cloud seeding and liquid water in clouds. See my post http://calderup.wordpress.com/2010/05/03/do-clouds-disappear/ By the way, that research also disposes of a morsel of doubt in the new CLOUD paper, about whether the small specks made by cosmic rays really grow sufficiently to seed cloud droplets.
As knowledge accumulated behind their dam and threatened to overtop it, the warmists had one last course to lay. Paradoxically it was CLOUD. Long delays with this experiment to explore the microchemical mechanism of the Svensmark effect became the chief excuse for deferring any re-evaluation of the Sun’s role in climate change. When the microchemical mechanism was revealed prematurely by the SKY experiment in Copenhagen and published in 2006, the warmists said, “No particle accelerator? That won’t do! Wait for CLOUD.” When the experiment in Aarhus confirmed the mechanism using a particle accelerator they said, “Oh that’s just the Danes again! Wait for CLOUD.”
Well they’ve waited and their dam has failed them.
Hall of Shame
Retracing those 14 years, what if physics had functioned as it is supposed to do? What if CLOUD, quickly approved and funded, had verified the Svensmark effect with all the authority of CERN, in the early 2000s. What if the Intergovernmental Panel on Climate Change had done a responsible job, acknowledging the role of the Sun and curtailing the prophecies of catastrophic warming?
For a start there would have no surprise about the “travesty” that global warming has stopped since the mid-1990s, with the Sun becoming sulky. Vast sums might have been saved on misdirected research and technology, and on climate change fests and wheezes of every kind. The world’s poor and their fragile living environment could have had far more useful help than precautions against warming.
And there would have been less time for so many eminent folk from science, politics, industry, finance, the media and the arts to be taken in by man-made climate catastrophe. (In London, for example, from the Royal Society to the National Theatre.) Sadly for them, in the past ten years they’ve crowded with their warmist badges into a Hall of Shame, like bankers before the crash.
As I reported on May 14th, 2011 in Update on the CERN CLOUD experiment:
From Physics World Head in a CLOUD:
In this special video report for physicsworld.com CLOUD project leader Jasper Kirkby explains what his team is trying to achieve with its experiment. “We’re trying to understand what the connection is between a cosmic ray going through the atmosphere and the creation of so-called aerosol seeds – the seed for a cloud droplet or an ice particle,” Kirkby explains.
The CLOUD experiment recreates these cloud-forming processes by directing the beamline at CERN’s proton synchrotron into a stainless-steel chamber containing very pure air and selected trace gases.
One of the aims of the experiment is to discover details of cloud formation that could feed back into climate models. “Everybody agrees that clouds have a huge effect on the climate. But the understanding of how big that effect is is really very poorly known,” says Kirkby.
Here’s the video, click image below to launch it.
Cosmic rays get ahead in CLOUD
http://www.rsc.org/chemistryworld/News/2011/August/24081102.asp
Cloud formation may be linked to cosmic rays
http://www.nature.com/news/2011/110824/full/news.2011.504.html
Cloud formation study casts a shadow over certain climate models
http://www.u.tv/News/Cloud-formation-study-casts-a-shadow-over-certain-climate-models/ddd312e6-c710-49d0-9a5d-e41e544024a9
======================================================
Update: From Nigel Calder’s blog
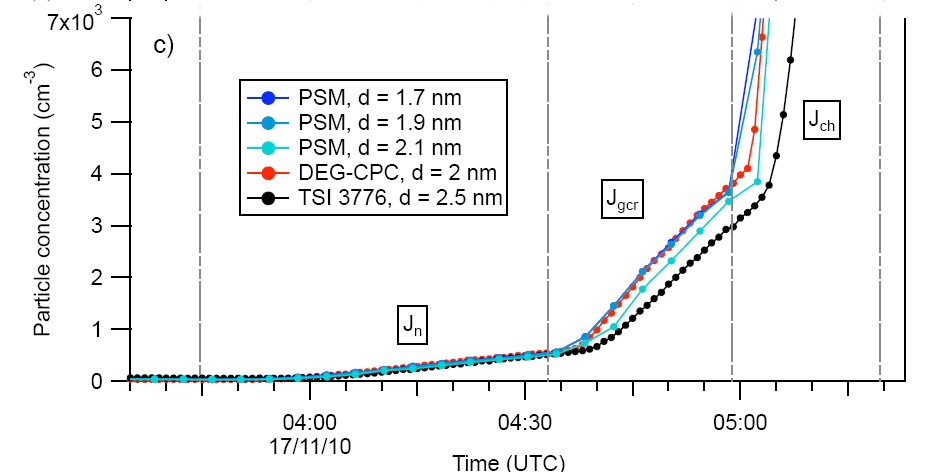
A graph they’d prefer you not to notice. Tucked away near the end of online supplementary material, and omitted from the printed CLOUD paper in Nature, it clearly shows how cosmic rays promote the formation of clusters of molecules (“particles”) that in the real atmosphere can grow and seed clouds. In an early-morning experimental run at CERN, starting at 03.45, ultraviolet light began making sulphuric acid molecules in the chamber, while a strong electric field cleansed the air of ions. It also tended to remove molecular clusters made in the neutral environment (n) but some of these accumulated at a low rate. As soon as the electric field was switched off at 04.33, natural cosmic rays (gcr) raining down through the roof of the experimental hall in Geneva helped to build clusters at a higher rate. How do we know they were contributing? Because when, at 04.58, CLOUD simulated stronger cosmic rays with a beam of charged pion particles (ch) from the accelerator, the rate of cluster production became faster still. The various colours are for clusters of different diameters (in nanometres) as recorded by various instruments. The largest (black) took longer to grow than the smallest (blue). This is Fig. S2c from supplementary online material for J. Kirkby et al., Nature, 476, 429-433, © Nature 2011.
Then there was this paper in August - September 2011:
Europe: diurnal temperatures after Forbush decreases
A. Dragić, I. Aničin, R. Banjanac, V. Udovičić, D. Joković´, D. Maletić and J. Puzović, “Forbush decreases – clouds relation in the neutron monitor era”, Astrophysics and Space Sciences Transactions, 7, 315–318, 2011.
The focus was on the “natural experiments” in which big puffs of gas from the Sun block some of the cosmic rays coming from the Galaxy towards the Earth. The resulting falls in cosmic ray influx, called Forbush decreases, last for a few days. The game is to look for observable reductions in cloudiness in the aftermath of these events. The results are most clearly favourable to the Svensmark hypothesis for the Forbush decreases with the largest percentage reductions in cosmic rays.
(A Forbush decrease is a rapid decrease in the observed galactic cosmic ray intensity following a coronal mass ejection (CME). It occurs due to the magnetic field of the plasma solar wind sweeping some of the galactic cosmic rays away from Earth.)
Then there was this one:Nigel Calder reports on "Yet another trick of cosmic rays"
Reblogged from Calder's Updates
In the climax to the Danes' experiments, cloud seeds flout the theories:
Near to the end of the story that starts with stars exploding in the Galaxy and ends with extra clouds gathering, a small but important paragraph was missing till now. From experiments in Copenhagen reported in 2006 and reconfirmed in 2011 in Aarhus and Geneva (CERN, CLOUD), cosmic rays coming from old supernovas can indeed make molecular clusters a few millionths of a millimetre wide, floating in the air. But can these aerosols really grow nearly a million times in mass to be large enough to become “cloud condensation nuclei” on which water droplets can form – as required by Henrik Svensmark’s cosmic theory of climate change?
Opponents pointed out that theoretical models said No, the growth of additional aerosols would be blocked by a resulting shortage of condensable gases like sulphuric acid in the atmosphere.
Now for the first time, an unexpected trick that Mother Nature had up her sleeve is revealed by experiment. The discovery is elegantly explained by a new way in which sulphuric acid forms in the atmosphere, as announced in a paper by Svensmark and two of his colleagues in Denmark’s National Space Institute in Copenhagen, Martin Enghoff and Jens Olaf Pepke Pedersen. They have submitted it to Physical Review Letters. A preprint is available on arXiv here http://arxiv.org/abs/1202.5156v1
A brief history.
Last year’s attempts to dismiss the Aarhus and CERN results as inconsequential for climate change didn’t dismay the Danes. They knew there was something wrong with the current understanding because they had observational support for the whole chain from solar activity to cosmic rays to aerosols to clouds in the real atmosphere (Svensmark, Bondo and Svensmark 2009). In order to dig into the physics, they decided to rebuild, in the basement of the Space Institute, the 8 cubic metre experimental chamber SKYII which six years ago was used as the CLOUD prototype chamber at CERN,
In the limelight of the atmospheric drama, sulphuric acid is one of the commonest of trace gases and very important for both the formation and the growth of aerosols. When the Sun rises in the morning, its ultraviolet rays convert sulphur dioxide, ozone and water vapour in the air into sulphuric acid molecules. These are continuously lost as they club together with further water and a little ammonia into very small molecular clusters. Nevertheless, the concentration of sulphuric acid rises to a peak and then diminishes as the Sun goes down in the evening.
A clue that something more is going on comes from the persistence all through the night of sulphuric acid at about 10 per cent of the daytime maximum. If these molecules too are continuously lost, they must be replenished by a chemical reaction that doesn’t need ultraviolet light.
What did the new experiment called SKY2 show? Without going into technical details that you’ll find in the paper, let’s just say that the primary result flatly contradicts the theoretical prediction that the infant aerosols couldn’t grow up into cloud condensation nuclei. Here’s a figure from the paper.

Molecular clusters grow over time, in the SKY2 experiment in Copenhagen. The horizontal axis is scaled in nanometres (millionths of a millimetre) and each blue point shows the relative number of clusters of that size before and after the experimental runs. Anything over 1.0 means that growth has continued. In contrast, the red points illustrate a pessimistic prediction of previous theories, that growth should cease when the size passes 50 nanometres. On the other hand, the black curve running through the blue points shows what is to be expected if there is a continual supply of sulphuric acid. The persistent growth of clusters occurs only in the presence of gamma rays that simulate cosmic rays and set electrons free to influence the chemistry.
So what’s the explanation? What new pathway supplies the sulphuric acid needed to keep the growth going? The Danes recall a suggestion in their 2006 SKY report that electrons can act like catalysts, being used over and over again to promote chemical action. In the new paper they say: A possible explanation could be that the charged clusters are producing additional [sulphuric acid] molecules from reactions involving negative ion chemistry of [ozone, sulphur dioxide and water], where a negative ion can be reused in a catalytic production of several [sulphuric acid molecules].
Depending on the concentrations of trace gases, several may mean dozens. And where do the electrons come from? They are liberated by cosmic rays raining down by night as well as by day. If the results of the experiment and these ideas are confirmed, there’s an amazing pay-off. The cosmic rays help to make the extra sulphuric acid that allows (1) a number of additional aerosols to form and (2) a larger number of aerosols to grow into cloud condensation nuclei. Without this second effect the aerosols would grow slowly and most of the extra aerosols would be lost before becoming large enough to seed clouds.
That ions liberated by cosmic rays promote a second pathway for forming sulphuric acid was already known from an experiment performed in Copenhagen in a collaboration with the University of Copenhagen and the Technical University of Tokyo (see the Enghoff et al. reference below). Depending on whether the sulphuric acid comes from ultraviolet action or is ion-induced, it has different signatures in the relative abundances of isotopes of sulphur. What’s more, the number of molecules made by the ion route greatly surpassed the number of ions available, again implying reuse of the electrons in a catalytic fashion.
To summarize the latest paper, the Svensmark, Enghoff and Pepke Pedersen abstract reads:
In experiments where ultraviolet light produces aerosols from trace amounts of ozone, sulphur dioxide, and water vapour, the number of additional small particles produced by ionization by gamma sources all grow up to diameters larger than 50 nm, appropriate for cloud condensation nuclei. This result contradicts both ion-free control experiments and also theoretical models that predict a decline in the response of larger particles due to an insufficiency of condensable gases (which leads to slower growth) and to larger losses by coagulation between the particles. This unpredicted experimental finding points to a process not included in current theoretical models, possibly an ion-induced formation of sulphuric acid in small clusters.
Scandals of a political character engulf climate physics these days, but future historians may shake their heads more sadly over scientific negligence. Isn’t it amazing that such a fundamental activity of sulphuric acid, going on over your head right now, has passed unnoticed since 1875 when cloud seeding was discovered, since 1996 when Svensmark found the link between cosmic rays and cloud cover, and since 2006 when the Danes suggested the catalytic role of electrons? Perhaps the experts were confused by the ever-present dislike of the role of the Sun in climate change.
So Svensmark and the small team in Copenhagen have had nearly all of the breakthroughs to themselves. And the chain of experimental and observational evidence is now much more secure:
Supernova remnants → cosmic rays → solar modulation of cosmic rays → variations in cluster and sulphuric acid production → variation in cloud condensation nuclei → variation in low cloud formation → variation in climate.
Svensmark won’t comment publicly on the new paper until it’s accepted for publication. But I can report that, in conversation, he sounds like a man who has reached the end of a very long trek in defiance of continual opposition and mockery.
References
Henrik Svensmark, Martin B. Enghoff and Jens Olaf Pepke Pedersen, “Response of Cloud Condensation Nuclei (> 50 nm) to changes in ion-nucleation”, submitted for publication 2012. Preprint available at http://arxiv.org/abs/1202.5156v1
H. Svensmark, T. Bondo and J. Svensmark, “Cosmic ray decreases affect atmospheric aerosols and clouds”, Geophysical Research Letters, 36, L15101, 2009
Henrik Svensmark, Jens Olaf Pepke Pedersen, Nigel Marsh, Martin Enghoff and Ulrik Uggerhøj, ‘Experimental Evidence for the Role of Ions in Particle Nucleation under Atmospheric Conditions’, Proceedings of the Royal Society A, Vol. 463, pp. 385–96, 2007 (online release 2006). This was the original SKY experiment in a basement in Copenhagen.
M. B. Enghoff, N. Bork, S. Hattori, C. Meusinger, M. Nakagawa, J. O. P. Pedersen, S. Danielache, Y. Ueno, M. S. Johnson, N. Yoshida, and H. Svensmark, “An isotope view on ionising radiation as a source of sulphuric acid”, Atmos. Chem. Phys. Discuss., 12, 5039–5064, 2012. See http://www.atmos-chem-phys-discuss.net/12/5039/2012/acpd-12-5039-2012.html
Then finally there was this one reported via The Hockey Schtick:New paper finds significant, natural decrease in cloudiness over past 50 years
A paper published last week finds that cloud cover over China significantly decreased during the period 1954-2005. This finding is in direct contradiction to the theory of man-made global warming which presumes that warming allegedly from CO2 'should' cause an increase in water vapor and cloudiness. The authors also find the decrease in cloud cover was not related to man-made aerosols, and thus was likely a natural phenomenon, potentially a result of increased solar activity via the Svensmark theory or other mechanisms. As climatologist Dr. Roy Spencer has pointed out his book,
"The most obvious way for warming to be caused naturally is for small, natural fluctuations in the circulation patterns of the atmosphere and ocean to result in a 1% or 2% decrease in global cloud cover. Clouds are the Earth’s sunshade, and if cloud cover changes for any reason, you have global warming — or global cooling."Significant decreasing cloud cover during 1954–2005 due to more clear-sky days and less overcast days in China and its relation to aerosol
LAGEO, Institute of Atmospheric Physics, Chinese Academy of Sciences, Beijing, 100029, China
Abstract. An updated analysis of cloud cover during 1954–2005 in China was performed using homogeneous cloud cover data from 314 stations. Long-term changes in frequencies of different cloud cover categories and their contributions to long-term changes in cloud cover were assessed. Furthermore, aerosol effects on cloud cover trends were discussed based on comparison of cloud cover trends in polluted and mildly polluted regions. Frequencies of clear sky (cloud cover <20%) and overcast days (cloud cover >80%) were observed to increase by ~2.2 days and decrease by ~3.3 days per decade, respectively, which accounts for ~80% of cloud cover reduction. Larger decreasing trends in cloud cover due to larger increase in clear sky frequency and larger decreases in overcast frequency were observed at stations with lower aerosol optical depth. There is no significant difference in trends regarding cloud cover, clear sky frequency, and overcast frequency between mountain and plain stations. These results are inconsistent with our expectation that larger decreasing trends in cloud cover should have been observed in regions with higher aerosol loading where more aerosols could lead to stronger obscuring effect on ground observation of cloud cover and stronger radiative effect as compared with the mildly polluted regions. Aerosol effect on decreasing cloud cover in China appear not to be supported by this analysis and therefore, further study on this issue is required. Full paper can be seen here.
No doubt there will be more updates on this subject soon.