Saturday, July 24, 2010

Dr. Roy Spencer's Global Warming For Dummies

In the recent tradition of (Insert subject here) for Dummies instruction booklets that have become all the rage Dr. Roy Spencer of the University of Alabama (Huntsville) has written an informative and easy to read laypersons booklet on Global Warming. Naturally in the tradition he called it My Global Warming Skepticism, for Dummies.

I receive many e-mails, and a recurring complaint is that many of my posts are too technical to understand. This morning’s installment arrived with the subject line, “Please Talk to Us”, and suggested I provide short, concise, easily understood summaries and explanations “for dummies”.

So, here’s a list of basic climate change questions, and brief answers based upon what I know today. I might update them as I receive suggestions and comments. I will also be adding links to other sources, and some visual aids, as appropriate.

Deja vu tells me I might have done this once before, but I’m too lazy to go back and see. So, I’ll start over from scratch.

It is important to understand at the outset that those of us who are skeptical of mankind’s influence on climate have a wide variety of views on the subject, and we can’t all be right. In fact, in this business, it is really easy to be wrong. It seems like everyone has a theory of what causes climate change. But it only takes one of us to be right for the IPCC’s anthropogenic global warming (AGW) house of cards to collapse.

As I like to say, taking measurements of the climate system is much easier than figuring out what those measurements mean in terms of cause and effect. Generally speaking, it’s not the warming that is in dispute…it’s the cause of the warming.

If you disagree with my views on something, please don’t flame me. Chances are, I’ve already heard your point of view; very seldom am I provided with new evidence I haven’t already taken into account.

1) Are Global Temperatures Rising Now?

There is no way to know, because natural year-to-year variability in global temperature is so large, with warming and cooling occurring all the time. What we can say is that surface and lower atmospheric temperature have risen in the last 30 to 50 years, with most of that warming in the Northern Hemisphere. Also, the magnitude of recent warming is somewhat uncertain, due to problems in making long-term temperature measurements with thermometers without those measurements being corrupted by a variety of non-climate effects. But there is no way to know if temperatures are continuing to rise now…we only see warming (or cooling) in the rearview mirror, when we look back in time.

2) Why Do Some Scientists Say It’s Cooling, while Others Say that Warming is Even Accelerating?

Since there is so much year-to-year (and even decade-to-decade) variability in global average temperatures, whether it has warmed or cooled depends upon how far back you look in time. For instance, over the last 100 years, there was an overall warming which was stronger toward the end of the 20th Century. This is why some say “warming is accelerating”. But if we look at a shorter, more recent period of time, say since the record warm year of 1998, one could say that it has cooled in the last 10-12 years. But, as I mentioned above, neither of these can tell us anything about whether warming is happening “now”, or will happen in the future.

3) Haven’t Global Temperatures Risen Before?

Yes. In the longer term, say hundreds to thousands of years, there is considerable indirect, proxy evidence (not from thermometers) of both warming and cooling. Since humankind can’t be responsible for these early events, this is evidence that nature can cause warming and cooling. If that is the case, it then opens up the possibility that some (or most) of the warming in the last 50 years has been natural, too. While many geologists like to point to much larger temperature changes are believed to have occurred over millions of years, I am unconvinced that this tells us anything of use for understanding how humans might influence climate on time scales of 10 to 100 years.

4) But Didn’t the “Hockey Stick” Show Recent Warming to be Unprecedented?

The “hockey Stick” reconstructions of temperature variations over the last 1 to 2 thousand years have been a huge source of controversy. The hockey stick was previously used by the IPCC as a veritable poster child for anthropogenic warming, since it seemed to indicate there have been no substantial temperature changes over the last 1,000 to 2,000 years until humans got involved in the 20th Century. The various versions of the hockey stick were based upon limited amounts of temperature proxy evidence — primarily tree rings — and involved questionable statistical methods. In contrast, I think the bulk of the proxy evidence supports the view that it was at least as warm during the Medieval Warm Period, around 1000 AD. The very fact that recent tree ring data erroneously suggests cooling in the last 50 years, when in fact there has been warming, should be a warning flag about using tree ring data for figuring out how warm it was 1,000 years ago. But without actual thermometer data, we will never know for sure.

5) Isn’t the Melting of Arctic Sea Ice Evidence of Warming?

Warming, yes…manmade warming, no. Arctic sea ice naturally melts back every summer, but that meltback was observed to reach a peak in 2007. But we have relatively accurate, satellite-based measurements of Arctic (and Antarctic) sea ice only since 1979. It is entirely possible that late summer Arctic Sea ice cover was just as low in the 1920s or 1930s, a period when Arctic thermometer data suggests it was just as warm. Unfortunately, there is no way to know, because we did not have satellites back then. Interestingly, Antarctic sea ice has been growing nearly as fast as Arctic ice has been melting over the last 30+ years.

6) What about rising sea levels?

I must confess, I don’t pay much attention to the sea level issue. I will say that, to the extent that warming occurs, sea levels can be expected to also rise to some extent. The rise is partly due to thermal expansion of the water, and partly due to melting or shedding of land-locked ice (the Greenland and Antarctic ice sheets, and glaciers). But this says nothing about whether or not humans are the cause of that warming. Since there is evidence that glacier retreat and sea level rise started well before humans can be blamed, causation is — once again — a major source of uncertainty.

7) Is Increasing CO2 Even Capable of Causing Warming?

There are some very intelligent people out there who claim that adding more carbon dioxide to the atmosphere can’t cause warming anyway. They claim things like, “the atmospheric CO2 absorption bands are already saturated”, or something else very technical. [And for those more technically-minded persons, yes, I agree that the effective radiating temperature of the Earth in the infrared is determined by how much sunlight is absorbed by the Earth. But that doesn't mean the lower atmosphere cannot warm from adding more greenhouse gases, because at the same time they also cool the upper atmosphere]. While it is true that most of the CO2-caused warming in the atmosphere was there before humans ever started burning coal and driving SUVs, this is all taken into account by computerized climate models that predict global warming. Adding more “should” cause warming, with the magnitude of that warming being the real question. But I’m still open to the possibility that a major error has been made on this fundamental point. Stranger things have happened in science before.

8 ) Is Atmospheric CO2 Increasing?

Yes, and most strongly in the last 50 years…which is why “most” climate researchers think the CO2 rise is the cause of the warming. Our site measurements of CO2 increase from around the world are possibly the most accurate long-term, climate-related, measurements in existence.

9) Are Humans Responsible for the CO2 Rise?

While there are short-term (year-to-year) fluctuations in the atmospheric CO2 concentration due to natural causes, especially El Nino and La Nina, I currently believe that most of the long-term increase is probably due to our use of fossil fuels. But from what I can tell, the supposed “proof” of humans being the source of increasing CO2 — a change in the atmospheric concentration of the carbon isotope C13 — would also be consistent with a natural, biological source. The current atmospheric CO2 level is about 390 parts per million by volume, up from a pre-industrial level estimated to be around 270 ppm…maybe less. CO2 levels can be much higher in cities, and in buildings with people in them.

10) But Aren’t Natural CO2 Emissions About 20 Times the Human Emissions?

Yes, but nature is believed to absorb CO2 at about the same rate it is produced. You can think of the reservoir of atmospheric CO2 as being like a giant container of water, with nature pumping in a steady stream into the bottom of the container (atmosphere) in some places, sucking out about the same amount in other places, and then humans causing a steady drip-drip-drip into the container. Significantly, about 50% of what we produce is sucked out of the atmosphere by nature, mostly through photosynthesis. Nature loves the stuff. CO2 is the elixir of life on Earth. Imagine the howls of protest there would be if we were destroying atmospheric CO2, rather than creating more of it.

11) Is Rising CO2 the Cause of Recent Warming?

While this is theoretically possible, I think it is more likely that the warming is mostly natural. At the very least, we have no way of determining what proportion is natural versus human-caused.

12) Why Do Most Scientists Believe CO2 is Responsible for the Warming?

Because (as they have told me) they can’t think of anything else that might have caused it. Significantly, it’s not that there is evidence nature can’t be the cause, but a lack of sufficiently accurate measurements to determine if nature is the cause. This is a hugely important distinction, and one the public and policymakers have been misled on by the IPCC.

13) If Not Humans, What could Have Caused Recent Warming?

This is one of my areas of research. I believe that natural changes in the amount of sunlight being absorbed by the Earth — due to natural changes in cloud cover — are responsible for most of the warming. Whether that is the specific mechanism or not, I advance the minority view that the climate system can change all by itself. Climate change does not require an “external” source of forcing, such as a change in the sun.

14) So, What Could Cause Natural Cloud Changes? I think small, long-term changes in atmospheric and oceanic flow patterns can cause ~1% changes in how much sunlight is let in by clouds to warm the Earth. This is all that is required to cause global warming or cooling. Unfortunately, we do not have sufficiently accurate cloud measurements to determine whether this is the primary cause of warming in the last 30 to 50 years.

15) How Significant is the Climategate Release of E-Mails?

While Climategate does not, by itself, invalidate the IPCC’s case that global warming has happened, or that humans are the primary cause of that warming, it DOES illustrate something I emphasized in my first book, “Climate Confusion”: climate researchers are human, and prone to bias.

16) Why Would Bias in Climate Research be Important? I thought Scientists Just Follow the Data Where It Leads Them

When researchers approach a problem, their pre-conceived notions often guide them. It’s not that the IPCC’s claim that humans cause global warming is somehow untenable or impossible, it’s that political and financial pressures have resulted in the IPCC almost totally ignoring alternative explanations for that warming.

17) How Important Is “Scientific Consensus” in Climate Research?

In the case of global warming, it is nearly worthless. The climate system is so complex that the vast majority of climate scientists — usually experts in variety of specialized fields — assume there are more knowledgeable scientists, and they are just supporting the opinions of their colleagues. And among that small group of most knowledgeable experts, there is a considerable element of groupthink, herd mentality, peer pressure, political pressure, support of certain energy policies, and desire to Save the Earth — whether it needs to be saved or not.

18) How Important are Computerized Climate Models?

I consider climate models as being our best way of exploring cause and effect in the climate system. It is really easy to be wrong in this business, and unless you can demonstrate causation with numbers in equations, you are stuck with scientists trying to persuade one another by waving their hands. Unfortunately, there is no guarantee that climate models will ever produce a useful prediction of the future. Nevertheless, we must use them, and we learn a lot from them. My biggest concern is that models have been used almost exclusively for supporting the claim that humans cause global warming, rather than for exploring alternative hypotheses — e.g. natural climate variations — as possible causes of that warming.

19) What Do I Predict for Global Temperature Changes in the Future?

I tend to shy away from long-term predictions, because there are still so many uncertainties. When pressed, though, I tend to say that I think cooling in our future is just as real a possibility as warming. Of course, a third possibility is relatively steady temperatures, without significant long-term warming or cooling. Keep in mind that, while you will find out tomorrow whether your favorite weather forecaster is right or wrong, no one will remember 50 years from now a scientist today wrongly predicting we will all die from heat stroke by 2060.

Concluding Remarks

Climate researchers do not know nearly as much about the causes of climate change as they profess. We have a pretty good understanding of how the climate system works on average…but the reasons for small, long-term changes in climate system are still extremely uncertain.

The total amount of CO2 humans have added to the atmosphere in the last 100 years has upset the radiative energy budget of the Earth by only 1%. How the climate system responds to that small “poke” is very uncertain. The IPCC says there will be strong warming, with cloud changes making the warming worse. I claim there will be weak warming, with cloud changes acting to reduce the influence of that 1% change. The difference between these two outcomes is whether cloud feedbacks are positive (the IPCC view), or negative (the view I and a minority of others have).

So far, neither side has been able to prove their case. That uncertainty even exists on this core issue is not appreciated by many scientists!

Again I will emphasize, some very smart people who consider themselves skeptics will disagree with some of my views stated above, particularly when it involves explanations for what has caused warming, and what has caused atmospheric CO2 to increase.

Unlike the global marching army of climate researchers the IPCC has enlisted, we do not walk in lockstep. We are willing to admit, “we don’t really know”, rather than mislead people with phrases like, “the warming we see is consistent with an increase in CO2″, and then have the public think that means, “we have determined, through our extensive research into all the possibilities, that the warming cannot be due to anything but CO2″.

Skeptics advancing alternative explanations (hypotheses) for climate variability represent the way the researcher community used to operate, before politics, policy outcomes, and billions of dollars got involved.

More Evidence Of Enhanced Global Temperature Data

In a series of recent posts I have been demonstrating that there was a considerable divergence between the surface station based temperature data sets of GISTemp, HadCRUT, and NCDC when they are compared with UAH and RSS satellite based systems. Yet the satellite based systems are virtually identical to each other. See Here, Here, Here and Here.

In this post Joseph D’Aleo who runs the ICECAP website writes about how NASA GISS has continued to undertake a Progressive Enhancement of Global Temperature Trends.

Recently we shared a story in the Wall Street Pit how NASA has gradually reduced the warm middle 20th century blip and created a more continuous warming. You can see in this 1976 National Geographic graph, a rather significant warm period starting in the 1920s and peaking during the dust bowl era in the United States in the 1930s and only slowly declining heading into the 1950s. It showed more significant cooling in the 1960s and 1970s. The story questioned where to from there.


The story showed three Hansen plots of global temperatures from 1980, 1987 and 2007 (above). The 1960s started out 0.3C colder than the 1950s in 1980, dropped to 0.05C colder by 1987 and was actually warmer by 0.05C in 2007. We have extracted the values from the graphs and superimposed them on the graph below. You can see the big 1980 to 1987 dropoff and subsequent further cooling by 2007 and 2010 (orange and red).


You can see how the picture from 1976 and 1980 changed rather dramatically in 1988 (with the record through 1987). That second graph was in time for the infamous Hansen
congressional testimony where it was introduced with Timothy Wirth’s (then senator and now the President of the United Nations Foundation and the Better World Fund) orchestrated ceremony which was scheduled on what was forecast to be the hottest day of the week with air conditioning turned off and windows opened and fans blowing hot air to a perspiring Hansen, committee and media.


The result of the changes has been to cool off the early and middle part of the record to accentuate the apparent warming trend. The anomalies are also affected. The base period for NASA to compute averages is 1951 to 1980. They lowered the average by about 0.115C or 0.207F. This increases the recent positive anomalies.


The data after 1990 has been in contrast adjusted up by station dropout (especially rural) and tenfold increase in missing months both of which forced more infilling and estimation, contamination by land use changes and urbanization, use of sensors not designed for climate trend analysis. These were described in detail in Surface Temperature records: Policy Driven Deception? here.
Hadley’s CRU has changed significantly just in the last decade in much the same way. The 1940 warm blip that worried Wigley and others was minimized which minimized the three decade cooling from 1940 to the late 1970s. The same issues mentioned above have exaggerated the recent warming.


The cooling of the base period for CRU (1961 to 1990) was 0.092C (0.16F).
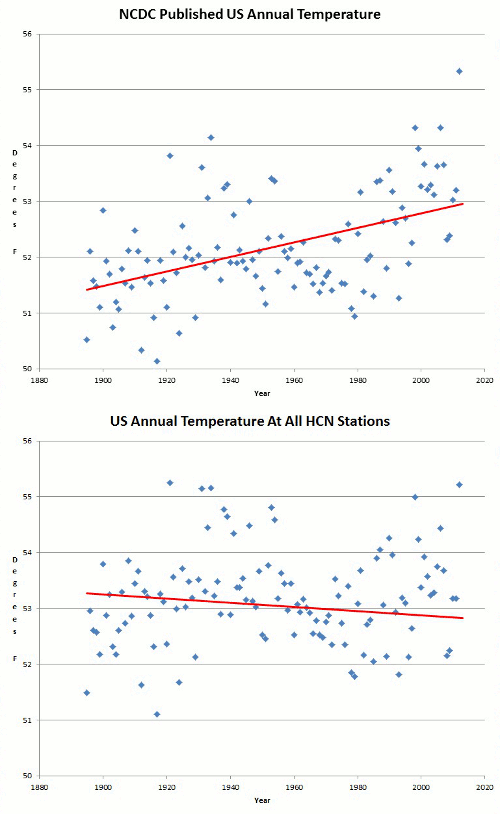
NOAA USHCN saw a change in 2007 that removed an urban adjustment and produced this annual change in US temperatures
. Again we see a cooling of the mid 20th century warm period and an elevation of recent years. .


We are working on a GHCN global change analysis. Charts like this which are common across the globe (This from Alan Cheetham) tell us we will probably find the same.


Once again we see the familiar trait with each progressive adjustment, older high temperatures that are inconvenient to the warmists argument are de-emphasised and later temperatures are over emphasised to give the illusion to the undiscerning eye of unprecedented warming compared to the past. Fortunately people like Joseph D'Aleo keep a watch and a track on these things and are prepared to ask the questions.

Thursday, June 10, 2010

Anthony Watts Discusses His Surface Stations Project

Ever wondered why NASA GISS and the NOAA based NCDC temperature data sets run much hotter than those of say UAH or RSS?


Anthony Watts may well have the answer:

Friday, June 4, 2010

Update On Wind Power Generation

In my earlier series on Power Generation I looked at Wind as a source: (Wind power - part 1, Wind power - part 2, Wind power - part 3). Journalist Terry McCrann has done a recent examination of Wind Power Generation as it applies in Australia in his article and has some interesting conclusions, via Andrew Bolt's blog : If we relied on wind power, Australia would have shut down . (My emphasis added)

image

The great green energy scam is exposed. The above chart shows the total electricity produced from May 13 to May 20 by all Australia’s windfarms, on which we’ve spent billions.

Terry McCrann:

Could any rational person—indeed, even gutless half-rational politician—build our energy supply on the total unreliability of so-called wind power.

This is what our total wind `power’ industry across southeastern Australia—NSW, Victoria and South Australia—delivered in one week in May. To all intents and effective purposes: ZERO power…

When the wind don’t blow the power don’t flow. Further, often the wind don’t blow at the same time, right across southeastern Australia… Further wind can go from very high power deliverability to very little in very short time spans.

So you don’t only need installed back-up power almost equivalent to the wind industry, to pick up the slack when it comes, but you need to keep it running, rendering utterly pointless having the wind power anyway.

Despite all the starry-eyed and empty-headed gazing at the power of the sun, wind is the only `practical’ alternative `renewable’ energy `source’ anytime soon.

Almost all our politicians are committed to 20 per cent alternative/renewable energy by 2020. It means a commitment to blackouts and brownouts—quite apart from unnecessarily higher power charges.

(No link to McCrann’s column.)

To confirm what Terry McCrann was saying I looked at the power generation by wind from all generators on 1st June 2010. This was the result:

The bottom graph shows a combined power peaked at less than 65MW of generation at approximately 4:30 in the morning then very little after that. If it wasn't for back up generation (probably from the La Trobe Valley's brown coal fired generators) much of the South East of Australia would have been blacked out. It also poses the questions, if you have signed up to pay for "green power" and none is available should you be paying the premium that is asked given you are instead being supplied by coal? Is this simply false advertising by the power companies when they cannot guarantee reliable supply? Are the consumers getting what they are paying for?

Tuvalu - The Defiant Island

In earlier posts (The 35 Errors in “An Inconvenient Truth” - Part 2, Rising Seas - Part 1,Rising Seas - Part 2) I have talked about the plight of the Southern Pacific Nation of Tuvalu. It has been one of the poster children of the pro AGW movement for a very long time but that may come to an end after it was found that the islands were in fact Growing not shrinking due to rising seas. Herald Sun columnist Andrew Bolt investigates in this article: What’s drowning is not Tuvalu but the alarmists.

Remember this great scare, which turned Tuvalu into the poster island of the global warming faith?

More than 75 million people living on Pacific islands will have to relocate by 2050 because of the effects of climate change, Oxfam has warned.

It was a scare whipped up by Al Gore, of course, in his Oscar-winning “documentary” An Inconvenient Truth:

That’s why the citizens of these Pacific nations have all had to evacuate to New Zealand

Tuvalu amped up its victim status, which was its best chance of winning not just foreign aid but permission to settle in Western countries. So it’s Prime Minister in 2003 told the United Nations;

The threat is real and serious, and is of no difference to a slow and insidious form of terrorism against us.

Whole institutions were devoted to preaching - especially to children - this scare that poor islanders were being drowned by our emissions:

At an exhibition launched at Melbourne’s Immigration Museum this week, an environment expert, Rob Gell, says it is virtually a foregone conclusion that Tuvalu will be uninhabitable within the next 50 years.

Foregone conclusion is right. Professor Mohammed Dore, an environmental economist from Dore University, couldn’t wait for warming and declared Tuvalu uninhabited already, much to the surprise of its residents:

In fact, there is an island called Tuvalu, which was completely evacuated and New Zealand accepted all the residents because of sea level rising.

All of which culminated in this much-applauded tearful plea at the great warmist gathering at Copenhagen from Tuvalu’s delegate, Ian Fry, who wept for his tiny island country despite actually being an Australian National University student from Queanbeyan, 144km from any beach:


Naturally, Labor bought the scare completely, and in 2006 promised in its “Pacific climate change plan” to take in these “climate change refugees”:

Australia must prepare to take in a new class of environmental refugees from the Pacific if the worst fears of climate change are realised, federal Labor says…

Low-lying Pacific island states such as Kiribati, the Marshall Islands, and Tuvalu - which sit just a few metres above sea level - are at risk of being swamped as global warming forces sea levels to rise.

“We should be part of an international coalition which is prepared to do our fair share,” Opposition environment spokesman Anthony Albanese said.

“The alternative to that is to say, and I don’t think any Australian would accept this, that we’re going to sit by while people literally drown.”

Stop! Hold the scare right there. The farce has gone on long enough.

Here’s the latest study, just in:

Climate scientists have expressed surprise at findings that many low-lying Pacific islands are growing, not sinking.

Islands in Tuvalu, Kiribati and the Federated States of Micronesia are among those which have grown, largely due to coral debris, land reclamation and sediment.

The findings, published in the magazine New Scientist, were gathered by comparing changes to 27 Pacific islands over the last 20 to 60 years using historical aerial photos and satellite images.

Auckland University’s Associate Professor Paul Kench, a member of the team of scientists, says the results challenge the view that Pacific islands are sinking due to rising sea levels associated with climate change.

Eighty per cent of the islands we’ve looked at have either remained about the same or, in fact, gotten larger,” he said.

UPDATE

As for that terrible sea rise at Tuvalu, the Bureau of Meteorology can’t detect much to panic about from the South Pacific Sea Level and Climate Monitoring Project:

image

When Scientists Go Bad

In my previous post entitled Would You Trust Truth Fudgers? I looked at the recent change in position of The Royal Society and how both NASA and the CSIRO from Australia had been caught manipulating data and ignoring other data to support their case. In this post I am looking at an article by Dr. David Archibald entitled Why Scientists Get It Wrong where he examines key personnel involved in the promotion of Climate Change against the back drop of the Climategate emails (my emphasis added):

If the data and forecasts in this book are correct, then the Intergovernmental Panel on Climate Change (IPCC), the National Academy of Sciences in the United States, the Royal Society in the United Kingdom, the Bureau of Meteorology and the CSIRO in Australia are all wrong. How can this be? Firstly, there aren’t that many scientists involved in the IPCC deliberations. The inner core is possibly twenty souls. Secondly, they were untroubled by the necessity to concoct fraudulent data to get their desired results. The only unknown question regarding the IPCC scientists is “Did they actually believe in the global warming that they were promoting?”

It turns out that they did, and possibly still do. That is shown by the Climategate emails released on 20th November, 2009. The Climategate emails are a selection of emails amongst members of the inner core plus minor characters. The fact that the IPCC scientists believed in the global warming they were promoting means that their morality at that level was better than expected, but it also means that they are a lot more stupid than expected. Nevertheless, their behaviour in promoting the notion of global warming using fraudulent statistics is reprehensible and hopefully they will be duly punished in this world or the next.

The history of the global warming fraud has been detailed in a number of books published recently, including a number on the climategate emails alone. A good analysis of the emails can be found in a book entitled The Climategate Emails by John Costella, which can be downloaded from the Lavoisier Group website.

One of the earliest Climategate emails shows how the results of research were tailored to a political script. On 29th July, 1999, Adam Markham of WWF (a non-government organisation formerly know as the World Wildlife Fund) wrote to University of East Anglia climate scientists Mike Hulme and Nicola Sheard, about a paper that Hulme and Sheard had written about climate change in Australasia:

I’m sure you will get some comments direct from Mike Rae in WWF Australia, but I wanted to pass on the gist of what they’ve said to me so far.

They are worried that this may present a slightly more conservative approach to the risks than they are hearing from Australian scientists. In particular, they would like to see the section on variability and extreme events beefed up if possible.

This email shows the role of the likes of WWF in coordinating a global consensus to stay on a consistent message. In this instance, they were worried that East Anglia report would be less scary than the Australian one.

The alarmists scientists also did their best to control the peer review process in order to stop the publication of papers critical of global warming theory. In 1999, Tom Wigley, one of the inner core, emailed his one of his co-conspirators (their word) to say:

I think we could get a large group of highly credentialed scientists to sign such a letter—50+ people. Note that I am copying this view only to Mike Hulme and Phil Jones. Mike’s idea to get the editorial board members to resign will probably not work—we must get rid of von Storch too.

On 20th January, 2005, Tom Wigley wrote with respect of another journal editor:

Proving bad behavior here is very difficult. If you think that Saiers is in the greenhouse skeptics camp, then, if we can find documentary evidence of this, we could go through official American Geophysical Union channels to get him ousted. Even this would be difficult.

Michael Mann, infamous for having concocted the hockey stick, replied:

Yeah, basically this is just a heads-up to people that something might be up here. What a shame that would be. It’s one thing to lose Climate Research. We can’t afford to lose Geophysical Research Letters.

What Dr Mann was afraid of was losing control of the climate papers published in Geophysical Research Letters.

If you think that it is a bit harsh to state that the alarmist scientists were aware that they were committing fraud, consider the next email from Phil Jones on 5th July, 2005:

This quote is from an Australian at the Bureau of Meteorology Research Centre, Melbourne (not Neville Nicholls). It began from the attached article. What an idiot. The scientific community would come down on me in no uncertain terms if I said the world had cooled from 1998. OK, it has, but it is only 7 years of data and it isn’t statistically significant.

This email shows that one of the major IPCC authors held views in private that he dare not state publicly. Post Climategate, Phil Jones has stated that the world has not warmed for the last fifteen years. Phil Jones was also aware that he had reason to hide data, as shown by this email dated 6th July, 2005:

I hope I don’t get a call from Congress! I’m hoping that no-one there realizes I have a United States Department of Energy grant, and have had this (with Tom Wigley) for the last 25 years.

Michael Mann was aware that perception was more important than reality in promoting global warming alarmism, as shown by this email from him dated 15th November, 2005 discussing work by Steve McIntyre:

He almost had a point with a mathematical issue, but as we all know, that doesn’t matter at all in the end. The issue isn’t whether or not he’s right, as we all well know by now, but whether his false assertions have enough superficial plausibility to get traction. In this case, they might, so it’s probably good to at least be prepared.

In the same email, Mann reports that they have taken back control of Geophysical Research Letters:

The Geophysical Research Letters leak may have been plugged up now with new editorial leadership there, but these guys always have Climate Research and Energy and Environment, and will go there if necessary.

Michael Mann’s talents weren’t limited to just stacking editorial panels at scientific journals, he also did Congressional committees, as shown by this email dated 13th February, 2006:

The panel is solid. Gerry North should do a good job in chairing this, and the other members are all solid. Christy is the token skeptic, but there are many others to keep him in check.

For those who still might consider that the underlying science is solid, despite the behaviour of the scientists, the following email shows that the alarmist scientists were well aware of the divergence between their models and reality. On 11th October, 2009, Kevin Trenberth, of the University Corporation for Atmospheric Research wrote:

Well I have my own article on “where the heck is global warming?” We are asking that here in Boulder where we have broken records the past two days for the coldest days on record. The fact is that we can’t account for the lack of warming at the moment and it is a travesty that we can’t. The data published in the August 2009 supplement on 2008 shows there should be even more warming: but the data are surely wrong. Our observing system is inadequate.

In the same vein, further from Kevin Trenberth on 14th October, 2009:

How come you do not agree with a statement that says we are nowhere close to knowing where energy is going or whether clouds are changing to make the planet brighter?

We are not close to balancing the energy budget. The fact that we cannot account for what is happening in the climate system makes any consideration of geo-engineering quite hopeless, as we will never be able to tell if it is successful or not! It is a travesty!

Now let’s proceed on to discussing error in the Australian scientific establishment. A very fresh example is a document published in March 2010 as a joint effort between the CSIRO and the Bureau of Meteorology called “State of the Climate”. In the preamble to the document, this statement is made:

The Bureau of Meteorology has been observing and reporting on weather in Australia for over 100 years, and CSIRO has been conducting atmospheric and marine research for over 60 years.

Now the CSIRO might be forgiven for not having a corporate memory more than 60 years long, but why did they and the Bureau of Meteorology only use 50 years of data to produce the following graph when they had more than 100 years of data they could have used?

Figure 71: Dubious graph from CSIRO and Bureau of Meteorology document

Well the reason they did not use a longer time period is that it would not have shown the warming trend that they needed to portray. They started their graph in the 1970s cooling period despite having a data record more than twice as long.

Evidence of how low these institutions have fallen is on the back page of the State of the Climate document, on which it is stated:

Australia will be hotter in coming decades

Australian average temperatures are projected to rise by 0.6 to 1.5 ºC by 2030. If global greenhouse gas emissions continue at current levels, warming is projected to be in the range of 2.2 to 5.0 ºC by 2070. Warming is projected to be lower near the coast and in Tasmania and higher in central and north-western Australia. These changes will be felt through an increase in the number of hot days.

It is very likely that human activities have caused most of the global warming observed since 1950

There is greater than 90% certainty that increases in greenhouse gas emissions have caused most of the global warming since the mid-20th century. International research shows that it is extremely unlikely that the observed warming could be explained by natural causes alone. Evidence of human influence has been detected in ocean warming, sea-level rise, continental-average temperatures, temperature extremes and wind patterns. CSIRO research has shown that higher greenhouse gas levels are likely to have caused about half of the winter rainfall reduction in south-west Western Australia.

Climate change is real

Our observations clearly demonstrate that climate change is real. CSIRO and the Bureau of Meteorology will continue to provide observations and research so that Australia’s responses are underpinned by science of the highest quality.

Consider the claim above that, "CSIRO research has shown that higher greenhouse gas levels are likely to have caused about half of the winter rainfall reduction in south-west Western Australia.” in the light of Figure 8 in this book showing that all the warming in the Perth temperature record in the last 100 years occurred in one year, 1976. These once-worthy institutions are relying upon a credulous public to swallow their absurd claims without question.

The CSIRO and Bureau of Meteorology management and research staff will eventually claim that they were relying upon IPCC research. But as one of the Climategate conspirators, Tom Wigley, said in an email dated 25th November, 1997:

No scientist who wishes to maintain respect in the community should ever endorse any statement unless they have examined the issue fully themselves.

On the subject of scientists not making statements unless they have examined the issue fully themselves, consider this one quoting Australia’s Chief Scientist, Professor Penny Sackett on 4th December, 2009:

The planet has just five years to avoid disastrous global warming, says the Federal Government’s chief scientist. Professor Penny Sackett yesterday urged all Australians to reduce their carbon footprint.

The Chief Scientist’s statement is idiotic and patently false, more worthy of a Chief Shaman. There is no physical evidence anywhere on the planet that “disastrous global warming” will start by 2014, or any time at all. The position of Chief Scientist should be the last line of defence of the Australian public from the depredations of any rent-seekers and carpetbaggers. Instead she has joined the chorus that wants to condemn the Australian nation to penury. The Bureau of Meteorology and the CSIRO have failed the Australian public dismally. That is putting it mildly. In truth, they have conspired against the Australian nation.

Professor Sackett’s most credible defence for making that idiotic statement might be that she has never associated with any climate scientists. Someone who did, Professor James Lovelock, is quoted by the Guardian newspaper on 29th March, 2010 as saying:

The great climate science centres around the world are more than well aware how weak their science is. If you talk to them privately they’re scared stiff of the fact that they don’t really know what the clouds and the aerosols are doing. They could be absolutely running the show. We haven’t got the physics worked out yet.

I have seen this happen before, of course. We should have been warned by the CFC/ozone affair because the corruption of science in that was so bad that something like 80% of the measurements being made during that time were either faked, or incompetently done.

Figure 72: Global Historical Climate Network raw and adjusted temperatures, Darwin Airport

Back on the subject of alarmist scientists fraudulently concocting data, Figure 72 above shows the manipulation applied to Darwin’s temperature record in order to manufacture a warming trend. The blue line is the original raw data which shows a significant cooling trend of 0.7°C per century. The red line is the adjusted data used to promote global warming alarmism. The black line shows the adjustment applied – a total of 2.2°C in sixty years! We can see that professionals did this job, because they added a little bit of cooling in the 1920s to make the uptrend seem more significant.

Figure 73: Data manipulation applied to the Prague, Czech Republic temperature record

Similar to Darwin, the warming scientists added over 2.2°C to the beginning of the Prague record to change an inconvenient cooling trend into a supportive warming one.

The corruption of the world’s temperature data sets by this sort of manipulation prompted the UK Met Office to announce on 25th February, 2010 that it is going to re-examine more than 150 years of global temperature records. The Met Office expects to take three years to complete the task, giving an indication of how corrupted the data set has become.

To paraphrase Samuel Johnson, ocean acidification is the last refuge of the global warming scoundrel. To put the ocean acidification scare into context of actual science, the current pH of the oceans is 8.1 (less than 7.0 is acid). If humanity burns all the rocks we can economically burn, the basicity of the oceans may fall to a pH of 8.0. There is physical evidence that marine organisms can live very happily with very high levels of carbon dioxide in seawater. This is shown by the following figure, in which very healthy corals are growing above a carbon dioxide vent:

Figure 74: Corals growing above a hydrothermal vent bubbling carbon dioxide, Dobu Island, Papua New Guinea

Consideration of the geological record also shows that increased atmospheric carbon dioxide cannot cause detrimental ocean acidification. The reef-building organisms first evolved about 500 million years ago when atmospheric carbon dioxide levels were up to twenty times what they are currently.

We again see a familiar pattern of misinformation, manipulations and half truths from those that support the notion of Anthropogenic Global Warming.

Saturday, May 29, 2010

Would You Trust Truth Fudgers?

In conversations that I have with AGW supporters from time to they often try to use Scientific Authority over factual information to support their argument. Comments such as "The Royal Society supports it" or "NASA says.." or in a more local context "The scientists from the CSIRO support.."But is authority the be all and end all in proving your case? Many supporters of AGW would have you believe that it is and that it is not only foolish to doubt them but even morally questionable to do so. Yet these same supporters would often once quote the Climate Research Unit of the University of East Anglia as "the" authoritative source of temperature measurement, yet since the unveiling of the Climategate emails and data the use of this authority is no longer used with any great regularity. So what then of the Royal Society, NASA and the CSIRO? They weren't involved in Climategate so there can't be any problems with what they say can there? These three articles may shed some light on recent changes or (very quiet) corrections that these three scientific pillars have recently made:

1. The Royal Society:

The UK's Royal Society is reviewing its public statements on climate change after 43 Fellows complained that it had oversimplified its messages.

They said the communications did not properly distinguish between what was widely agreed on climate science and what is not fully understood.

The society's ruling council has responded by setting up a panel to produce a consensus document.

...The review member said it might not be possible for the document to be agreed at all. "This is a very serious challenge to the way the society operates," I was told. "In the past we have been able to give advice to governments as a society without having to seek consensus of all the members.

...A Royal Society pamphlet Climate Change Controversies is the main focus of the criticism. A version of it is on the organisation's website. It was written in response to attacks on mainstream science which the Royal Society considered scurrilous.

It reads: "This is not intended to provide exhaustive answers to every contentious argument that has been put forward by those who seek to distort and undermine the science of climate change…"

One Fellow who said he was not absolutely convinced of the dangers of CO2 told me: "This appears to suggest that anyone who questions climate science is malicious. But in science everything is there to be questioned - that should be the very essence of the Royal Society. Some of us were very upset about that.

Whilst this is a relatively small change by the Royal Society it is as journalist Gerald Warner of the U.K. Telegraph puts it:

This development does not, of course, mean that the Royal Society is embracing climate scepticism. On the contrary, it is very reluctantly modifying its stance to accommodate some of its Fellows who take the very scientific position that a degree of agnosticism is good practice when hypotheses remain unproven. Yet this retreat from absolutist global warming orthodoxy will deeply dismay the AGW lobby. For years, there was no fiercer proponent of the AGW theory than the Royal Society. Its previous president Lord May notoriously stated: “The debate on climate change is over.”

But it is an admission on some level that the science is not settled and that the debate is far from over.

2. NASA:

NASA covered up for forty years proof that the greenhouse gas theory was bogus. But even worse, did the U.S. space agency fudge its numbers on Earth’s energy budget to cover up the facts?

As per my article this week, forty years ago the space agency, NASA, proved there was no such thing as a greenhouse gas effect because the ‘blackbody’ numbers supporting the theory didn’t add up in a 3-dimensional universe:

"During lunar day, the lunar regolith absorbs the radiation from the sun and transports it inward and is stored in a layer approximately 50cm thick....in contrast with a precipitous drop in temperature if it was a simple black body, the regolith then proceeds to transport the stored heat back onto the surface, thus warming it up significantly over the black body approximation..."

Thus, the ‘blackbody approximations' were proven to be as useful as a chocolate space helmet; the guesswork of using the Stefan-Boltzmann equations underpinning the man-made global warming theory was long ago debunked. If NASA had made known that Stefan-Boltzmann's numbers were an irrelevant red-herring then the taxpayers of the world would have been spared the $50 billion wasted on global warming research; because it would have removed the only credible scientific basis to support the theory that human emissions of carbon dioxide changed Earth’s climate.

But, until May 24, 2010 these facts remained swept under the carpet. For the Apollo missions NASA had successfully devised new calculations to safely put astronauts on the Moon-based on actual measured temperatures of the lunar surface. But no one appears to have told government climatologists who, to this day, insist their junk science is 'settled' based on their bogus ‘blackbody’ guesswork.

Again we find that the science isn't settled and that the debate is far from over and that the data may well have been disguised as it was inconvenient to the prevailing (unproven) theory on AGW. Which leads the author to conclude:

Thanks to Siddons and his co-authors of ‘A Greenhouse Effect on the Moon,’ the world now has scientific evidence to show the greenhouse gas theory (GHG) was junk all along.

As the truth now spreads, an increasing number of scientists refute the greenhouse gas theory, many have been prompted by the shocking revelations since the Climategate scandal. The public have also grown more aware of how a clique of government climatologists were deliberately ‘hiding the decline’ in the reliability of their proxy temperature data all along.

But NASA’s lunar temperature readings prove that behind that smoke was real fire. Some experts now boldly go so far as to say the entire global warming theory contravenes the established laws of physics.

How NASA responds to these astonishing revelations may well tell us how politicized the American space agency really is.

3. CSIRO:

FEDERAL Treasury and the CSIRO are supposed to be among the most trusted institutions in Australia. They are both supposed to be founded in objective rationalism.

...From the CSIRO we need, very simply, good science. As its own strategic plan puts it: "We are committed to scientific excellence and working ethically and with integrity in everything we do."

Both have, in their separate ways, breached that trust. This is a very serious matter for the governance of Australia. If we can't trust Treasury to give us rational economics and we can't trust the CSIRO to give us good, or even just honest, science -- as in both cases they have generally done for a good three-quarters of a century or more -- we are adrift in a sea of irrationalism.

For that, indeed, is what links the two failures: in each case an apparent triumph of theology over reason. First the CSIRO.

In March, it joined with the Bureau of Meteorology to produce a "snapshot of the state of the climate to update Australians about how their climate has changed and what it means". Although the pamphlet had a neutral title, "State of the Climate", it was clearly designed to bring the great weight of the apparent credibility of these two organisations to bear against, and hopefully crush, those pesky climate change sceptics.

But as one of the peskier of them, Tom Quirk -- our version of Canada's even peskier Stephen McIntyre -- discovered, there was a very curious omission in one of the CSIRO graphs. It showed the rise and rise of concentrations in the atmosphere of carbon dioxide and its fellow greenhouse gas methane. It was an almost perfect replica of the infamous (Michael) Mann Hockey Stick. After being virtually stable for 900 years, concentrations of both CO2 and methane went almost vertical through the 20th century. But as the eagle-eyed Quirk noticed and wrote about on Quadrant Online, methane was plotted only up to 1990, while the plots for CO2 continued to 2000.Why so, when the CSIRO measures methane concentrations and has data up to last year?

Did the answer lie in the inconvenient truth that methane concentrations have plateaued since the mid-1990s? Yet here is the CSIRO, the organisation dedicated to scientific truth, pretending -- even stating -- that they're still going up, Climategate style. This is bad enough, but just as with Treasury, real policies are built on this sort of "analysis". The first version of the so-called carbon pollution reduction scheme included farming to address the methane question. But as Quirk has shown in a peer-reviewed paper, atmospheric methane is driven by a combination of volcanos, El Ninos and pipeline (mostly dodgy old Soviet) leakage.

A second curious, and even dodgier, thing happened after Quirk's Quadrant report. CSIRO "updated" its main graph to include the more recent methane data. No admission was made and the graph's scale made it all but invisible and did not show the plateauing. Further, the CSIRO published a more detailed second graph showing what has happened in the past 30 years, as opposed to the first graph's 1000 years. But only for CO2, despite the fact that it had exactly the same data for methane.

In short, the CSIRO is a fully signed-up member of the climate change club. It wanted to project the horror story of continually rising greenhouse gas concentrations in the atmosphere. So it simply disappeared inconvenient evidence to the contrary, in the process announcing it cannot be trusted ever again to deliver objective scientific evidence.

But it didn't end there. Tom Quirk in his article CSIRO Blame Game states:

P. Fraser, a senior CSIRO scientist, reveals how a major document branded by the organisation was published and promoted. Apparently, the final draft “State of the Climate” report was not reviewed by CSIRO or BOM scientists themselves, and when it is questioned others are blamed for the errors it contains and the confused dating of information.

Fraser makes the point that the CSIRO team were the first to report a rise in methane again towards the end of 2006 at the end of the omitted plateau. The work of the group in atmospheric measurements is first class and arguably occasionally better than some of their US colleagues but their over eager interpretation may lead them astray. The claim of rising methane is an example (Figure 1) as the latest published measurements suggest otherwise with a decreasing trend.

Figure 1: Recent measurements of atmospheric methane. Instantaneous growth rate for globally averaged atmospheric methane (solid line; dashed lines are ±1 standard deviation).

The IPCC does not understand or cannot explain the behaviour of atmospheric methane. The CSIRO has done no better. Only time for more measurements and a better understanding of the sources and sinks of methane will resolve this issue. The science is uncertain and not a basis for any policy making that has the potential to cripple a large part of the coal mining industry.

More transparency and less selective presentation would help.

Whilst none of these articles disprove the theory of AGW what they do show is the levels of uncertainty that are still out there on AGW. Also they show that the argument of "authority" is often nothing more than that. It is not a statement of "fact." As Dr. Richard Lindzen puts it when speaking about "scientific authority":

What we are seeing again is the tendency for any claims to be made once the basis for the claim need only be ‘authority.’ Interestingly, the ‘authority’ frequently doesn’t say what it is claimed to have said. However, advocates (especially when in high government position) can rest assured that some ‘authority’ will come along to assent.

His slide show on Deconstructing Global Warming can be seen here.