Saturday, April 21, 2012

Part 2 of Professor Don Easterbrook's Concerns About The "Shakun et al Paper"

In an earlier post entitled CO2 Causes Temperature Change or Vice Versa? I showed the first part of Professor Don Easterbrook's response to the Shakun et al paper entitled Global warming preceded by increasing carbon dioxide concentrations during the last deglaciation.

As promised here is part two of Professor Easterbrook's response (via WUWT):

More fatal flaws in the Shakun et al. Nature paper claiming that CO2 preceeded late glacial warming [Part 2]

By Dr. Don Easterbrook

In Part 1 , I posed 11 questions related to underlying assumptions and misconceptions that form the basis for the paper “Global warming preceded by increasing carbon dioxide concentrations during the last deglaciation by Shakun et al. (Nature 2012) and discussed the first five questions related to the authors claim to have “compelling evidence that rising CO2 caused much of the global warming” and that “the CO2 change slightly preceded much of the global warming, and this means the global greenhouse effect had an important role in driving up global temperatures and bringing the planet out of the last Ice Age.”

Part 1 discussed problems related to the lack of direct dating of the Antarctic ice cores and the difficulty of accurately measuring CO2 in ice cores. In Part 2, we will look at the validity of the authors’ claims that (1) climate changes in Antarctica were out of phase with global climatic changes and Southern Hemisphere climatic changes have a ‘see-saw’ relationship with the Northern Hemisphere. These contentions are central to the whole theme of the paper. We’ll also have look at the Greenland ice cores as proxies for global climate change, the AMOC forcing as the only causal mechanism for climate change, why orbital forcing doesn’t work for the abruptness of climate changes, and if we make through all of that, we’ll look at some other causal mechanisms that the Shakun et al. paper casually dismiss.

As shown in Part 1, the lack of direct dating of Antarctic ice cores resulted in reliance on theoretically modeled, wiggle-curve correlations age estimates that are essentially just best guesses, not accurate measurements. How can we check the validity of the Antarctic ice core ages used in the paper? The nearest places to Antarctica where well-dated climate chronologies exist are New Zealand and southern South America. If the Southern Hemisphere is indeed out of phase with the Northern Hemisphere (the ‘see-saw’), we should see it also in the chronologies of New Zealand and South America. Let’s see how they compare with the Antarctic chronology. Two specific periods of climate change can be compared: (1) a late phase of the LGM ~17,000 years ago, and (2) the Younger Dryas 12,700 to 11,500 years ago. If the basic contentions of the Shakun et al. paper are correct, the chronology of these two climatic phases in Antarctic, New Zealand, and South America should be out of phase with the chronology of similar phases in the Northern Hemisphere.

New Zealand and Patagonia at the last glacial maximum

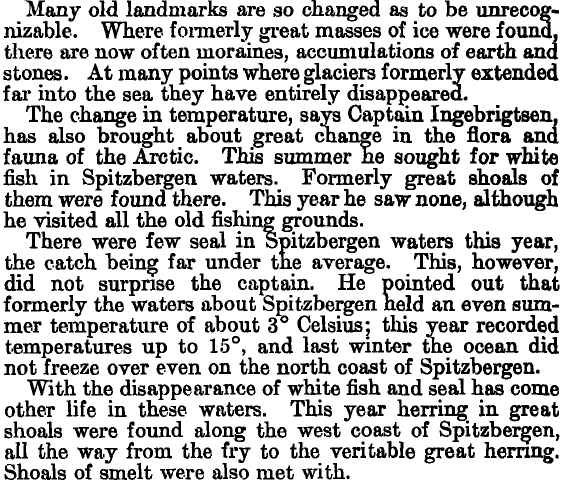
A well-defined, well dated set of glacial moraines marking the last glacial maximum enclose Lake Pukaki in the Southern Alps of New Zealand (Figure 1). Seven Beryllium 10 (10Be) age measurements of boulders on the terminal moraines average 17,400 years old (Schaefer et al., 2006; Easterbrook, 2011).

clip_image002clip_image004

10Be dates from moraines at Lake Pukaki, Glacial and pollen chronology from the

New Zealand. (Schaefer et al., 2006) southern Lake District of Chile.

LGM moraines and pollen from bogs in the Lake District of southern Chile have been extensively 14C dated. The average ages show an LGM at 17,400 years ago. LGM moraines surrounding Lago Buenos Aires in Patagonia have been 10Be dated at 16,000 and 18,800 years old (Kaplan et al., 2004).

Nineteen 10Be ages measured from boulders on moraines in the Tasmanian highlands of SE Australia range from 19,100 on terminal moraines to 15,oo0 on recessional moraines with a mean of 16,800 years. (Barrows et al., 2001, 2002).

What these well-dated chronologies are telling us is that the LGM occurred at the same time in the both the Northern and Southern and Hemispheres, i.e., the hemispheres are not out of phase with one another.

The Younger Dryas chronology

An even better climate chronology can be found during the Younger Dryas in New Zealand, which can be compared to the Antarctic YD chronology to test the Shakun et al. contentions. At least two phases of the Younger Dryas can be identified in both the Northern and Southern Hemisphere, making the YD an excellent test of whether or not the YD was synchronous in both hemispheres or was out of phase (as contended by Shakun et al.).

Southern Alps, New Zealand

New Zealand has a well-established Younger Dryas chronology at multiple localities in the Southern Alps. The YD double–moraine pattern is found in the glacial chronology at at Birch Hills along Lake Pukaki, Arthur’s Pass, Prospect Hills, Waiho Loop, and at several other localities. At Birch Hills ~40 km upvalley from the Lake Pukaki LGM moraines, 5 10Be dates from the outermost Birch Hills moraine average 12,800 years old and 4 10Be dates from the inner moraine average 11,200 years old. Another pair of YD moraines at Arthur’s Pass show a mean 10Be age of 11,800 years for the outermost YD moraine and 11,400 for the inner moraine. A YD moraine at Prospect Hills yielded 10Be dates of 12.7 and 12.8 years B.P. (Easterbrook, 2002, 2011).

On the west coast of South Island, wood in the Waiho Loop moraine, deposited by the Franz Josef Glacier about 20 km behind the LGM moraine, has been dated at 11,200 14C years (equivalent to a calendar year age of slightly less than 13,000 years). (Mercer, 1982, 1988; Denton and Hendy, 1994).

clip_image006clip_image008

Ages of Younger Dryas moraines in the Southern Alps of New Zealand.

clip_image010clip_image012

Ages of inner and outer YD moraines at Birch Hills in the Southern Alps.

Younger Dryas chronology in the Northern Hemisphere

At least two phases of the Younger Dryas are also well documented in the Northern Hemisphere at many localities in North America, the European Alps, Scandinavia, and eastern Europe. The chronology of these climatic events is well dated by radiocarbon. This provides the opportunity for comparison with the double phases of YD glaciation found in New Zealand and elsewhere. The double YD phases are found both in the record of continental ice sheet glaciation and in the alpine record.

Alkenone SST measurements from marine cores west of Vancouver Island indicate a temperature drop of ~3° C during the YD (Kienast and McKay, 2001). Cool-water foraminifera, suggesting YD cooling, have been found on the British Columbia shelf and in the Santa Barbara Basin. Cooling during the YD is also shown from pollen records in SW British Columbia, NW Washington, Oregon, and SE Alaska. The ages of multiple YD moraines of the Pleistocene Cordilleran Ice Sheet in NW Washington have been established by more than 100 radiocarbon dates at between 11,500 and 12,700 years old.

clip_image014 clip_image016

[A] Reconstruction of the YD phase of the [B] Ages of the double YD moraines of the

Cordilleran Ice Sheet in NW Washington Scandinavian Ice Sheet. Ages shown are 14C ages

11,500 and 12,700 years ago. equivalent to 11,500 and 12,700 years ago.

Alpine Glaciers

Dated YD moraines occur in the Wind River Range at Titcomb Basin and Temple Lake, and similar, moraines occur throughout the Rocky Mts. What is apparent from these examples of YD moraines is that not only was the YD climatic event recorded by alpine glaciers in western North America, but in many places double moraines record a dual YD climatic change.

Cirque glaciers expanded twice during the YD at Titcomb Lakes in the Wind River Range, WY. Erratics on moraines and glaciated bedrock ~33 km upvalley from LGM moraines at Freemont Lake, Wyoming, have been 10Be dated between 12,300 and 10,600 years old Birkeland, 1974; Zielinski and Davis, 1987; Davis, 1988; Davis and Osburn, 1987).

clip_image018 clip_image020

Double Younger Dryas moraines at Titcomob Ages of YD moraines in the Rocky Mts., ID

Lakes in the Wind River Mts., WY.

Cirque moraines at multiple elevations in the Sawtooth Range of Idaho also record two YD climatic events. Bench Lakes, north of Redfish Lake, consist of several glacial lakes at successively higher elevations, representing sequentially rising YD snowlines. The 10Be ages of boulders from range from 11,700 to 11,400 years. Thus, at least two phases of moraine building took place here during the YD.

Double, post–LGM moraines occur about 12 km upvalley from LGM moraines at Icicle Creek in the North Cascades of Washington. Boulders on the outmost YD moraine were 10Be-dated at 12,600 and 12,300 years and boulders on a younger YD moraine were dated at 11,300 and 11,900 years. All of the dates from the inner and outer moraines fall within the YD.

Double YD moraines occur at Julier Pass near St. Moritz, Switzerland and multiple YD moraines at Loch Lomond in the Scotish Highlands have been radiocarbon dated between 12,900 and 11,500 years old.

The Greenland GISP2 oxygen isotope record

The double phase of the Younger Dryas also appears in the Greenland GISP2 oxygen isotope record between 11,500 and 12,700 years ago, correlating very well with the global glacial record.

clip_image022

Double Younger Dryas event recorded in the GISP2 ice core

CONCLUSIONS

So what does all this mean and why is it important? The double nature of YD moraines in widely separated areas in both hemispheres suggests a common, global, climatic cause. The YD is characterized by two distinct moraines in widely separated parts of both the Northern and Southern Hemispheres and in the Pacific and Atlantic regions, indicating that the YD consisted of more than a single climatic event. This means that the twin YD cooling occurred virtually simultaneously globally and both ice sheets and alpine glaciers were sensitive to the dual YD cooling. The two YD phases in the GISP2 ice core confirm the globally synchronous climatic events. The global synchronicity of the late Pleistocene twin YD phases indicates a global atmospheric cause. The absence of a time lag between the N and S Hemispheres climatic fluctuations precludes an oceanic cause propagated from one hemisphere to the other. The sensitivity and synchronicity of worldwide climatic events with no apparent time lag between hemispheres means that abrupt climatic changes such as the YD were caused by simultaneous global changes.

So what does this mean about the validity of the contentions of Shakun et al. that the Northern and Southern Hemispheres were out of phase? Compare the age of the YD in their Figure 2 to the numerous YD chronologies from all over the world.

clip_image023

Shakun et al. Figure 2. The Red line is Antarctic temperature curve based on ice cores; the yellow dots are CO2 measurements from ice cores; the blue line is composite global temperature from 80 proxies.

The age of the YD shown on their Antarctic curve is from 13,000 to 14,700, nowhere near the age of the YD in New Zealand and the rest of the world. Considering the lack of adequate dating of the Antarctic ice cores and lack of correlation with New Zealand and global YD chronology, what this means is that their entire Antarctic curve is incorrect and needs to be shifted by nearly 2,000 years, taking with it the CO2 curve. This means that their entire argument for CO2 preceding warming during the last glaciation falls completely apart.

At this point, we haven’t yet gotten to issues with the AMOC, orbital forcing, or other possible causal mechanisms of climate change. Consideration of those issues would make this longer than most people would want to read at one sitting, so looks like they will have to await Part 3.

Once the third part is available I will post to it for those that are interested.

Thursday, April 19, 2012

Reporting Impending Climate Doom

There is a saying that nothing sells newspapers like bad news. Since the start of the current climate debate it is rare for there to be a good news climate story, most will concentrate on any story that is promoting gloom and doom, or even rampant alarmism, as can be seen here in the Climate Change section of The Age newspaper.

But the next time you see a story involving Ice bergs in unusual locations, shrinking ice in the Arctic with ships able to travel where they never have before, less seals or polar bears, penguins showing up in countries like France, less snow on the Matterhorn, or just generally weird weather, just remember it has been reported before and there isn't "unprecedented" as is so often claimed.

Some examples of previous stories include:
1846:
1912:

Of course in April 1912 a very famous iceberg was to strike the Titanic (who thought they were well south of the known Iceberg zone).
Should something similar happen today it would be reported as "proof" of Climate Change.

1922:
The following report was on the warming of the Arctic:


It also published in the Washington Post:


The same year penguins were reported as landing in France.

A similar Penguin occurrence happened only a few years ago in Brazil and it was widely touted as "undeniable proof" of Climate Change by the media. As for the reporting done by the Washington Post about vanishing seals and icebergs just ten years after one sank the Titanic is reminiscent of the type of reporting we see much more of today.
1930's: The following report is of a temperature rise seen world wide:
Then in 1932 (a mere twenty years after the Titanic sinking by an iceberg comes this report of Russians successfully circumnavigating a section of the Arctic that had never been done before.

At the same time in the US it was the "Grapes of Wrath" drought years and there were reports of climate refugees:

By 1938 there were reports citing data collected by the Russians in the Arctic that the world was indeed getting warmer. Despite the advent of the industrial revolution by more than seventy years at this stage there was no thought to blame man's emissions of CO2.
By 1947 a familiar tune to today was being sung in the Fairfax newspapers:

But at the time little did they realise that the climate had already turned to a cooling cycle. The same paper that had reported on eight years earlier that the Arctic was melting away and was going to drown us all was now reporting a weirding of the weather because it was raining so much and was getting colder. They quoted the same sources as today in the CSIRO who said it was "clear proof that our weather wasn't as it use to be."
By the mid 1970's the tune had changed dramatically. We were all still doomed by Climate Change only now it was because of the impending Ice Age not that silly warming that we had experienced back in the 1930's and 40's. The late Professor Stephen Schneider was big on this theory. He was also the one who later said:
"On the one hand we are ethically bound to the scientific method, in effect promising to tell the truth, the whole truth, and nothing but…which means that we must include all the doubts, caveats, ifs and buts.


On the other hand, we are not just scientists, but human beings as well. And like most people we’d like to see the world a better place, which in this context translates into our working to reduce the risk of potentially disastrous climate change. To do that we have to get some broad-based support, to capture the public’s imagination. That, of course, entails getting loads of media coverage. So we have to offer up scary scenarios, make simplified, dramatic statements, and make little mention of any doubts we might have."
1974 and 75:
Newsweek 1975:


TIME Magazine June 1974
:

 TIME Magazine June 1974: Another Ice Age?
In Africa, drought continues for the sixth consecutive year, adding terribly to the toll of famine victims. During 1972 record rains in parts of the U.S., Pakistan and Japan caused some of the worst flooding in centuries. In Canada’s wheat belt, a particularly chilly and rainy spring has delayed planting and may well bring a disappointingly small harvest. Rainy Britain, on the other hand, has suffered from uncharacteristic dry spells the past few springs. A series of unusually cold winters has gripped the American Far West, while New England and northern Europe have recently experienced the mildest winters within anyone’s recollection.
University of Toronto Climatologist Kenneth Hare, a former president of the Royal Meteorological Society, believes that the continuing drought and the recent failure of the Russian harvest gave the world a grim premonition of what might happen. Warns Hare: “I don’t believe that the world’s present population is sustainable if there are more than three years like 1972 in a row.”


Yet by the 1980's Professor James Hansen was again warning of Global Warming and that it was going to kill us all if we did nothing about it. Slowly the media began to change it reporting once again. This was despite other climate scientists saying that this warming had happened before and was worse back then:

Imagery was the key to getting people to believe this time and shots such as the following were used to show proof of Global Warming:

How could anyone deny this was nots so when the evidence was so clear, yet if we look at the same Matterhorn from2011 we see something closer to 1960 than 2005:
How strange we are not shown this shot in comparison with the 2005 photo as "proof" that the Earth has recovered or that another Ice age is on it's way.
Istead we are now presented in the form of blizzards as "undeniable proof" and further signs of Global Warming despite the world again not having warmed for the last 10 to 15 years.

I thing the caption on the poster says it all.

Friday, April 13, 2012

New Peer Reviewed Paper Claims Global Warming Not Human Influenced

In a peer reviewed paper by Horst-Joachim Ludecke, Rainer Link, and Friedrich-Karl Ewert for the International Journal of Modern Physics entitled: How Natural is the Recent Centennial Warming? An Analysis of 2249 Surface Temperature Records, the three authors conclude that they cannot find a definite human influence on the temperature over the past century and that at most any human warming is only "marginal."

Abstract.

We evaluate to what extent the temperature rise in the past 100 years was a trend or a natural fluctuation and analyze 2249 worldwide monthly temperature records from GISS (NASA) with the 100-year period covering 1906-2005 and the two 50-year periods from 1906 to 1955 and 1956 to 2005. No global records are applied. The data document a strong urban heat island e ffect (UHI) and a warming with increasing station elevation. For the period 1906-2005, we evaluate a global warming of 0.58 0C as the mean for all records. This decreases to 0.41 0C if
restricted to stations with a population of less than 1000 and below 800 meter above sea level. About a quarter of all the records for the 100-year period show a fall in temperatures. Our hypothesis for the analysis is - as generally in the papers concerned with long-term persistence of temperature records - that the observed temperature records are a combination of long-term correlated records with an additional trend, which is caused for instance by anthropogenic CO2, the UHI or other forcings. We apply the detrended fluctuation analysis (DFA) and evaluate Hurst exponents between 0.6 and 0.65 for the majority of stations, which is in excellent agreement with the literature and use a method only recently published, which is based on DFA, synthetic records and Monte Carlo simulation. As a result, the probabilities that the observed temperature series are natural have values roughly between 40% and 90%, depending on the stations characteristics and the periods considered. 'Natural' means that we do not have within a de fined confidence interval a de finitely positive anthropogenic contribution and, therefore, only a marginal anthropogenic contribution can not be excluded.

Conclusion:

In this paper, we have used 2249 unadjusted monthly temperature records of 100 and 50 years in length and evaluated the temperature changes for the periods 1906-2005, 1906-1955, and 1956-2005. Our analysis was based exclusively on local records and applied DFA, Monte Carlo methods and synthetic records. The main results and conclusions are the following.


a) The mean of all stations shows 0.58 0C global warming from 1906 to 2005. If we consider only those stations with a population of under 1000 and below 800 meter above sea level this gure drops to 0.41 0C and would probably decrease even further if we were to take into account the warm biases caused by the worldwide reduction in rural stations during the 1990s, by changes to the screens and their environments, and by the appearance of automatic observing systems.
b) From 1906 to 2005, about a quarter of all records show falling temperatures. This in itself is an indication that the observed temperature series are predominantly natural fluctuations. 'Natural' means that we do not have within a defi ned confidence interval a de finitely positive anthropogenic contribution and, therefore, only a marginal anthropogenic contribution can not be excluded. We evaluated - with a con fidence interval of 95% - the probability that the observed global warming from 1906 to 2005 was a natural fluctuation as lying between 40% and 70%, depending on the station's characteristics. For the period of 1906 to 1955 the probabilities are arranged between 80% and 90% and for 1956 to 2005 between 60% and 70%.

c) By separating stations into specifi c station groups, such as those with a de fined minimum population, a strong UHI and elevation warming can be identified.

d) The vast majority of temperature stations are found on land and in the northern hemisphere, and have Hurst exponent of a = 0:63 in such locations. However, two thirds of the Earth are covered with water, and the relatively few stations on islands or near oceans have higher Hurst exponent of a = 0:7. Therefore, a real exponent for the entire Earth could be somewhat higher than a = 0:63. Records with higher exponents embody even higher probabilities for natural fluctuations.

Cosmic Rays And Clouds Influence Climate

In earlier posts I have highlighted the link between cosmic rays and cloud creation and the CERN CLOUD experiments. In late 2011 there were some developments that appeared to re-enforce the emerging theory that there was other major influences on Earth's climate that did not involve CO2 and had not been investigated by the models or by the IPCC. The first of these are:
CERN Experiment Confirms Cosmic Rays Influence Climate Change.

by Nigel Calder

Long-anticipated results of the CLOUD experiment at CERN in Geneva appear in tomorrow’s issue of the journal Nature (25 August). The Director General of CERN stirred controversy last month, by saying that the CLOUD team’s report should be politically correct about climate change (see my 17 July post below). The implication was that they should on no account endorse the Danish heresy – Henrik Svensmark’s hypothesis that most of the global warming of the 20th Century can be explained by the reduction in cosmic rays due to livelier solar activity, resulting in less low cloud cover and warmer surface temperatures.

Willy-nilly the results speak for themselves, and it’s no wonder the Director General was fretful.

Jasper Kirkby of CERN and his 62 co-authors, from 17 institutes in Europe and the USA, announce big effects of pions from an accelerator, which simulate the cosmic rays and ionize the air in the experimental chamber. The pions strongly promote the formation of clusters of sulphuric acid and water molecules – aerosols of the kind that may grow into cloud condensation nuclei on which cloud droplets form. What’s more, there’s a very important clarification of the chemistry involved.

A breach of etiquette

My interest in CLOUD goes back nearly 14 years, to a lecture I gave at CERN about Svensmark’s discovery of the link between cosmic rays and cloudiness. It piqued Kirkby’s curiosity, and both Svensmark and I were among those who helped him to prepare his proposal for CLOUD.

By an unpleasant irony, the only Svensmark contribution acknowledged in theNature report is the 1997 paper (Svensmark and Friis-Christensen) on which I based my CERN lecture. There’s no mention of the successful experiments in ion chemistry and molecular cluster formation by the Danish team in Copenhagen, Boulby and latterly in Aarhus where they beat CLOUD to the first results obtained using a particle beam (instead of gamma rays and natural cosmic rays) to ionize the air in the experimental chamber – see http://calderup.wordpress.com/2011/05/17/accelerator-results-on-cloud-nucleation-2/

What will historians of science make of this breach of scientific etiquette? That Kirkby was cross because Svensmark, losing patience with the long delay in getting approval and funding for CLOUD, took matters into his own hands? Or because Svensmark’s candour about cosmic rays casting doubt on catastrophic man-made global warming frightened the national funding agencies? Or was Kirkby simply doing his best (despite the results) to obey his Director General by slighting all things Danish?

Personal rivalries aside, the important question is what the new CLOUD paper means for the Svensmark hypothesis. Pick your way through the cautious prose and you’ll find this:

Ion-induced nucleation [cosmic ray action] will manifest itself as a steady production of new particles [molecular clusters] that is difficult to isolate in atmospheric observations because of other sources of variability but is nevertheless taking place and could be quite large when averaged globally over the troposphere [the lower atmosphere].”

It’s so transparently favourable to what the Danes have said all along that I’m surprised the warmists’ house magazine Nature is able to publish it, even omitting the telltale graph shown at the start of this post. Added to the already favourable Danish experimental findings, the more detailed CERN result is excellent. Thanks a million, Jasper.

Enlightening chemistry

And in friendlier times we’d be sharing champagne for a fine discovery with CLOUD, that traces of ammonia can increase the production of the sulphuric clusters a thousandfold. It’s highlighted in the report’s title: “Role of sulphuric acid, ammonia and galactic cosmic rays in atmospheric aerosol nucleation” and it was made possible by the more elaborate chemical analysis in the big-team set-up in Geneva. In essence, the ammonia helps to stabilize the molecular clusters.

Although not saying it openly, the CLOUD team implies a put-down for the Danes with this result, repeatedly declaring that without ammonia there’d be little cluster production at low altitudes. But although the Aarhus experimenters did indeed assume the simpler reaction (H2SO4 + H2O), differing results in successive experimental runs made them suspect that varying amounts of trace impurities were present in the air cylinders used to fill their chamber. Now it looks as if a key impurity may have been ammonia. But some members of the CLOUD consortium also favoured (H2SO4 + H2O) and early runs in Geneva used no intentional ammonia. So they’ve little reason to scoff.

In any case, whether the basic chemistry is (H2SO4 + H2O) or (H2SO4 + H2O + NH3) is an academic rather than a practical point. There are always traces of ammonia in the real air, and according to the CLOUD report you need only one molecule in 30 billion. If that helps to oil Svensmark’s climatic motor, it’s good to know, but it calls for no apologies and alters the climatic implications not a jot.

The experiment’s logo. The acronym “Cosmics Leaving Outdoor Droplets” always implied strong interest in Svensmark’s hypothesis. And the roles of the Galaxy and the Sun are acknowledged.

Technically, CLOUD is a welcome advance on the Danish experiments. Not only is the chemistry wider ranging but molecular clusters as small as 1.7 nanometres in diameter are detectable, compared with 4 nm in Denmark. And the set-up enables the scientists to study the ion chemistry at lower temperatures, corresponding to increasing altitudes in the atmosphere. Cluster production soars as the temperature goes down, until “almost every negative ion gives rise to a new particle” [i.e. molecular cluster]. The lowest temperature reported in the paper is -25 oC. That corresponds to an altitude of 6000 metres, so unless you wish to visualize a rain of cloud-seeding aerosols from on high, it’s not very relevant to Svensmark’s interest in the lowest 3000 metres.

How the warmists built their dam

Shifting from my insider’s perspective on the CLOUD experiment, to see it on the broader canvas of the politicized climate science of the early 21st Century, the chief reaction becomes a weary sigh of relief. Although they never said so, the High Priests of the Inconvenient Truth – in such temples as NASA-GISS, Penn State and the University of East Anglia – always knew that Svensmark’s cosmic ray hypothesis was the principal threat to their sketchy and poorly modelled notions of self-amplifying action of greenhouse gases.

In telling how the obviously large influences of the Sun in previous centuries and millennia could be explained, and in applying the same mechanism to the 20th warming, Svensmark put the alarmist predictions at risk – and with them the billions of dollars flowing from anxious governments into the global warming enterprise.

For the dam that was meant to ward off a growing stream of discoveries coming from the spring in Copenhagen, the foundation was laid on the day after the Danes first announced the link between cosmic rays and clouds at a space conference in Birmingham, England, in 1996. “Scientifically extremely naïve and irresponsible,”Bert Bolin declared, as Chairman of the Intergovernmental Panel on Climate Change.

As several journalists misbehaved by reporting the story from Birmingham, the top priority was to tame the media. The first courses of masonry ensured that anything that Svensmark and his colleagues might say would be ignored or, failing that, be promptly rubbished by a warmist scientist. Posh papers like The Times of London and the New York Times, and posh TV channels like the BBC’s, readily fell into line. Enthusiastically warmist magazines like New Scientist and Scientific American needed no coaching.

Similarly the journals Nature and Science, which in my youth prided themselves on reports that challenged prevailing paradigms, gladly provided cement for higher masonry, to hold the wicked hypothesis in check at the scientific level. Starve Svensmark of funding. Reject his scientific papers but give free rein to anyone who criticizes him. Trivialize the findings in the Holy Writ of the Intergovernmental Panel on Climate Change. None of this is paranoia on my part, but a matter of close personal observation since 1996.

“It’s the Sun, stupid!” The story isn’t really about a bunch of naughty Danish physicists. They are just spokesmen for the most luminous agent of climate change. As the Sun was what the warmists really wanted to tame with their dam, they couldn’t do it. And coming to the Danes’ aid, by briefly blasting away many cosmic rays with great puffs of gas, the Sun enabled the team to trace in detail the consequent reduction in cloud seeding and liquid water in clouds. See my post http://calderup.wordpress.com/2010/05/03/do-clouds-disappear/ By the way, that research also disposes of a morsel of doubt in the new CLOUD paper, about whether the small specks made by cosmic rays really grow sufficiently to seed cloud droplets.

As knowledge accumulated behind their dam and threatened to overtop it, the warmists had one last course to lay. Paradoxically it was CLOUD. Long delays with this experiment to explore the microchemical mechanism of the Svensmark effect became the chief excuse for deferring any re-evaluation of the Sun’s role in climate change. When the microchemical mechanism was revealed prematurely by the SKY experiment in Copenhagen and published in 2006, the warmists said, “No particle accelerator? That won’t do! Wait for CLOUD.” When the experiment in Aarhus confirmed the mechanism using a particle accelerator they said, “Oh that’s just the Danes again! Wait for CLOUD.”

Well they’ve waited and their dam has failed them.

Hall of Shame

Retracing those 14 years, what if physics had functioned as it is supposed to do? What if CLOUD, quickly approved and funded, had verified the Svensmark effect with all the authority of CERN, in the early 2000s. What if the Intergovernmental Panel on Climate Change had done a responsible job, acknowledging the role of the Sun and curtailing the prophecies of catastrophic warming?

For a start there would have no surprise about the “travesty” that global warming has stopped since the mid-1990s, with the Sun becoming sulky. Vast sums might have been saved on misdirected research and technology, and on climate change fests and wheezes of every kind. The world’s poor and their fragile living environment could have had far more useful help than precautions against warming.

And there would have been less time for so many eminent folk from science, politics, industry, finance, the media and the arts to be taken in by man-made climate catastrophe. (In London, for example, from the Royal Society to the National Theatre.) Sadly for them, in the past ten years they’ve crowded with their warmist badges into a Hall of Shame, like bankers before the crash.

=========================================================

As I reported on May 14th, 2011 in Update on the CERN CLOUD experiment:

From Physics World Head in a CLOUD:

In this special video report for physicsworld.com CLOUD project leader Jasper Kirkby explains what his team is trying to achieve with its experiment. “We’re trying to understand what the connection is between a cosmic ray going through the atmosphere and the creation of so-called aerosol seeds – the seed for a cloud droplet or an ice particle,” Kirkby explains.

The CLOUD experiment recreates these cloud-forming processes by directing the beamline at CERN’s proton synchrotron into a stainless-steel chamber containing very pure air and selected trace gases.

One of the aims of the experiment is to discover details of cloud formation that could feed back into climate models. “Everybody agrees that clouds have a huge effect on the climate. But the understanding of how big that effect is is really very poorly known,” says Kirkby.

Here’s the video, click image below to launch it.

Cosmic rays get ahead in CLOUD
http://www.rsc.org/chemistryworld/News/2011/August/24081102.asp
Cloud formation may be linked to cosmic rays
http://www.nature.com/news/2011/110824/full/news.2011.504.html
Cloud formation study casts a shadow over certain climate models
http://www.u.tv/News/Cloud-formation-study-casts-a-shadow-over-certain-climate-models/ddd312e6-c710-49d0-9a5d-e41e544024a9

======================================================

Update: From Nigel Calder’s blog


A graph they’d prefer you not to notice. Tucked away near the end of online supplementary material, and omitted from the printed CLOUD paper in Nature, it clearly shows how cosmic rays promote the formation of clusters of molecules (“particles”) that in the real atmosphere can grow and seed clouds. In an early-morning experimental run at CERN, starting at 03.45, ultraviolet light began making sulphuric acid molecules in the chamber, while a strong electric field cleansed the air of ions. It also tended to remove molecular clusters made in the neutral environment (n) but some of these accumulated at a low rate. As soon as the electric field was switched off at 04.33, natural cosmic rays (gcr) raining down through the roof of the experimental hall in Geneva helped to build clusters at a higher rate. How do we know they were contributing? Because when, at 04.58, CLOUD simulated stronger cosmic rays with a beam of charged pion particles (ch) from the accelerator, the rate of cluster production became faster still. The various colours are for clusters of different diameters (in nanometres) as recorded by various instruments. The largest (black) took longer to grow than the smallest (blue). This is Fig. S2c from supplementary online material for J. Kirkby et al., Nature, 476, 429-433, © Nature 2011.

Then there was this paper in August - September 2011:

Europe: diurnal temperatures after Forbush decreases

A. Dragić, I. Aničin, R. Banjanac, V. Udovičić, D. Joković´, D. Maletić and J. Puzović, “Forbush decreases – clouds relation in the neutron monitor era”, Astrophysics and Space Sciences Transactions, 7, 315–318, 2011.

The focus was on the “natural experiments” in which big puffs of gas from the Sun block some of the cosmic rays coming from the Galaxy towards the Earth. The resulting falls in cosmic ray influx, called Forbush decreases, last for a few days. The game is to look for observable reductions in cloudiness in the aftermath of these events. The results are most clearly favourable to the Svensmark hypothesis for the Forbush decreases with the largest percentage reductions in cosmic rays.

(A Forbush decrease is a rapid decrease in the observed galactic cosmic ray intensity following a coronal mass ejection (CME). It occurs due to the magnetic field of the plasma solar wind sweeping some of the galactic cosmic rays away from Earth.)

Then there was this one:
Nigel Calder reports on "Yet another trick of cosmic rays"
Reblogged from Calder's Updates
In the climax to the Danes' experiments, cloud seeds flout the theories:

Near to the end of the story that starts with stars exploding in the Galaxy and ends with extra clouds gathering, a small but important paragraph was missing till now. From experiments in Copenhagen reported in 2006 and reconfirmed in 2011 in Aarhus and Geneva (CERN, CLOUD), cosmic rays coming from old supernovas can indeed make molecular clusters a few millionths of a millimetre wide, floating in the air. But can these aerosols really grow nearly a million times in mass to be large enough to become “cloud condensation nuclei” on which water droplets can form – as required by Henrik Svensmark’s cosmic theory of climate change?

Opponents pointed out that theoretical models said No, the growth of additional aerosols would be blocked by a resulting shortage of condensable gases like sulphuric acid in the atmosphere.

Now for the first time, an unexpected trick that Mother Nature had up her sleeve is revealed by experiment. The discovery is elegantly explained by a new way in which sulphuric acid forms in the atmosphere, as announced in a paper by Svensmark and two of his colleagues in Denmark’s National Space Institute in Copenhagen, Martin Enghoff and Jens Olaf Pepke Pedersen. They have submitted it to Physical Review Letters. A preprint is available on arXiv here http://arxiv.org/abs/1202.5156v1

A brief history.

Last year’s attempts to dismiss the Aarhus and CERN results as inconsequential for climate change didn’t dismay the Danes. They knew there was something wrong with the current understanding because they had observational support for the whole chain from solar activity to cosmic rays to aerosols to clouds in the real atmosphere (Svensmark, Bondo and Svensmark 2009). In order to dig into the physics, they decided to rebuild, in the basement of the Space Institute, the 8 cubic metre experimental chamber SKYII which six years ago was used as the CLOUD prototype chamber at CERN,

In the limelight of the atmospheric drama, sulphuric acid is one of the commonest of trace gases and very important for both the formation and the growth of aerosols. When the Sun rises in the morning, its ultraviolet rays convert sulphur dioxide, ozone and water vapour in the air into sulphuric acid molecules. These are continuously lost as they club together with further water and a little ammonia into very small molecular clusters. Nevertheless, the concentration of sulphuric acid rises to a peak and then diminishes as the Sun goes down in the evening.

A clue that something more is going on comes from the persistence all through the night of sulphuric acid at about 10 per cent of the daytime maximum. If these molecules too are continuously lost, they must be replenished by a chemical reaction that doesn’t need ultraviolet light.

What did the new experiment called SKY2 show? Without going into technical details that you’ll find in the paper, let’s just say that the primary result flatly contradicts the theoretical prediction that the infant aerosols couldn’t grow up into cloud condensation nuclei. Here’s a figure from the paper.


Molecular clusters grow over time, in the SKY2 experiment in Copenhagen. The horizontal axis is scaled in nanometres (millionths of a millimetre) and each blue point shows the relative number of clusters of that size before and after the experimental runs. Anything over 1.0 means that growth has continued. In contrast, the red points illustrate a pessimistic prediction of previous theories, that growth should cease when the size passes 50 nanometres. On the other hand, the black curve running through the blue points shows what is to be expected if there is a continual supply of sulphuric acid. The persistent growth of clusters occurs only in the presence of gamma rays that simulate cosmic rays and set electrons free to influence the chemistry.

So what’s the explanation? What new pathway supplies the sulphuric acid needed to keep the growth going? The Danes recall a suggestion in their 2006 SKY report that electrons can act like catalysts, being used over and over again to promote chemical action. In the new paper they say: A possible explanation could be that the charged clusters are producing additional [sulphuric acid] molecules from reactions involving negative ion chemistry of [ozone, sulphur dioxide and water], where a negative ion can be reused in a catalytic production of several [sulphuric acid molecules].

Depending on the concentrations of trace gases, several may mean dozens. And where do the electrons come from? They are liberated by cosmic rays raining down by night as well as by day. If the results of the experiment and these ideas are confirmed, there’s an amazing pay-off. The cosmic rays help to make the extra sulphuric acid that allows (1) a number of additional aerosols to form and (2) a larger number of aerosols to grow into cloud condensation nuclei. Without this second effect the aerosols would grow slowly and most of the extra aerosols would be lost before becoming large enough to seed clouds.

That ions liberated by cosmic rays promote a second pathway for forming sulphuric acid was already known from an experiment performed in Copenhagen in a collaboration with the University of Copenhagen and the Technical University of Tokyo (see the Enghoff et al. reference below). Depending on whether the sulphuric acid comes from ultraviolet action or is ion-induced, it has different signatures in the relative abundances of isotopes of sulphur. What’s more, the number of molecules made by the ion route greatly surpassed the number of ions available, again implying reuse of the electrons in a catalytic fashion.

To summarize the latest paper, the Svensmark, Enghoff and Pepke Pedersen abstract reads:

In experiments where ultraviolet light produces aerosols from trace amounts of ozone, sulphur dioxide, and water vapour, the number of additional small particles produced by ionization by gamma sources all grow up to diameters larger than 50 nm, appropriate for cloud condensation nuclei. This result contradicts both ion-free control experiments and also theoretical models that predict a decline in the response of larger particles due to an insufficiency of condensable gases (which leads to slower growth) and to larger losses by coagulation between the particles. This unpredicted experimental finding points to a process not included in current theoretical models, possibly an ion-induced formation of sulphuric acid in small clusters.

Scandals of a political character engulf climate physics these days, but future historians may shake their heads more sadly over scientific negligence. Isn’t it amazing that such a fundamental activity of sulphuric acid, going on over your head right now, has passed unnoticed since 1875 when cloud seeding was discovered, since 1996 when Svensmark found the link between cosmic rays and cloud cover, and since 2006 when the Danes suggested the catalytic role of electrons? Perhaps the experts were confused by the ever-present dislike of the role of the Sun in climate change.

So Svensmark and the small team in Copenhagen have had nearly all of the breakthroughs to themselves. And the chain of experimental and observational evidence is now much more secure:

Supernova remnants cosmic rays solar modulation of cosmic rays variations in cluster and sulphuric acid production variation in cloud condensation nuclei variation in low cloud formation variation in climate.

Svensmark won’t comment publicly on the new paper until it’s accepted for publication. But I can report that, in conversation, he sounds like a man who has reached the end of a very long trek in defiance of continual opposition and mockery.

References

Henrik Svensmark, Martin B. Enghoff and Jens Olaf Pepke Pedersen, “Response of Cloud Condensation Nuclei (> 50 nm) to changes in ion-nucleation”, submitted for publication 2012. Preprint available at http://arxiv.org/abs/1202.5156v1

H. Svensmark, T. Bondo and J. Svensmark, “Cosmic ray decreases affect atmospheric aerosols and clouds”, Geophysical Research Letters, 36, L15101, 2009

Henrik Svensmark, Jens Olaf Pepke Pedersen, Nigel Marsh, Martin Enghoff and Ulrik Uggerhøj, ‘Experimental Evidence for the Role of Ions in Particle Nucleation under Atmospheric Conditions’, Proceedings of the Royal Society A, Vol. 463, pp. 385–96, 2007 (online release 2006). This was the original SKY experiment in a basement in Copenhagen.

M. B. Enghoff, N. Bork, S. Hattori, C. Meusinger, M. Nakagawa, J. O. P. Pedersen, S. Danielache, Y. Ueno, M. S. Johnson, N. Yoshida, and H. Svensmark, “An isotope view on ionising radiation as a source of sulphuric acid”, Atmos. Chem. Phys. Discuss., 12, 5039–5064, 2012. See http://www.atmos-chem-phys-discuss.net/12/5039/2012/acpd-12-5039-2012.html

Then finally there was this one reported via The Hockey Schtick:
New paper finds significant, natural decrease in cloudiness over past 50 years

A paper published last week finds that cloud cover over China significantly decreased during the period 1954-2005. This finding is in direct contradiction to the theory of man-made global warming which presumes that warming allegedly from CO2 'should' cause an increase in water vapor and cloudiness. The authors also find the decrease in cloud cover was not related to man-made aerosols, and thus was likely a natural phenomenon, potentially a result of increased solar activity via the Svensmark theory or other mechanisms. As climatologist Dr. Roy Spencer has pointed out his book,
"The most obvious way for warming to be caused naturally is for small, natural fluctuations in the circulation patterns of the atmosphere and ocean to result in a 1% or 2% decrease in global cloud cover. Clouds are the Earth’s sunshade, and if cloud cover changes for any reason, you have global warming — or global cooling."
Significant decreasing cloud cover during 1954–2005 due to more clear-sky days and less overcast days in China and its relation to aerosol

X. Xia
LAGEO, Institute of Atmospheric Physics, Chinese Academy of Sciences, Beijing, 100029, China


Abstract. An updated analysis of cloud cover during 1954–2005 in China was performed using homogeneous cloud cover data from 314 stations. Long-term changes in frequencies of different cloud cover categories and their contributions to long-term changes in cloud cover were assessed. Furthermore, aerosol effects on cloud cover trends were discussed based on comparison of cloud cover trends in polluted and mildly polluted regions. Frequencies of clear sky (cloud cover <20%) and overcast days (cloud cover >80%) were observed to increase by ~2.2 days and decrease by ~3.3 days per decade, respectively, which accounts for ~80% of cloud cover reduction. Larger decreasing trends in cloud cover due to larger increase in clear sky frequency and larger decreases in overcast frequency were observed at stations with lower aerosol optical depth. There is no significant difference in trends regarding cloud cover, clear sky frequency, and overcast frequency between mountain and plain stations. These results are inconsistent with our expectation that larger decreasing trends in cloud cover should have been observed in regions with higher aerosol loading where more aerosols could lead to stronger obscuring effect on ground observation of cloud cover and stronger radiative effect as compared with the mildly polluted regions. Aerosol effect on decreasing cloud cover in China appear not to be supported by this analysis and therefore, further study on this issue is required. Full paper can be seen here.
No doubt there will be more updates on this subject soon.