“people should expect more Category 4 and 5 hurricanes if the ocean waters continue to warm.” - Al Gore
“scientists had been giving warnings that hurricanes will get stronger because of “global warming.” - Al Gore
…“also heavier rains and floods, and stronger storms driven by latent heat, including tropical storms, tornados and thunderstorms. " – Dr. James Hansen
“Hurricanes are becoming more frequent in North America.’’ – Dr. Tim Flannery
“storms are growing stronger with each passing hurricane season” (implying that this is due to CO2 increases). - President-Elect Barack Obama Nov 2008
"storms that are growing stronger with each passing hurricane season." (as above) – California Governor Arnold Schwarzenegger.
"Expert analysis points to severe global and national consequences including rising sea levels, more severe weather events…" - Australian Prime Minister Kevin Rudd.
Yet the data from NOAA disputes both of these assertions of increased frequency and strength. As can be seen from the figure above there has been no increase in frequency of Hurricanes in general, or in the number of category 3-5 hurricanes. The data does not lie (unlike many politicians).
The figure above is for Australian cyclones and it also shows no increase in frequency or severity.
Yes, the Atlantic has seen a very large increase in major hurricanes during the 14-year period of 1995-2008 (average 3.9 per year) in comparison to the prior 25-year period of 1970-1994 (average 1.5 per year). But, have rises in CO2 been, in any way, been responsible for the recent large upswing in Atlantic basin major hurricanes since 1995?
I and a number of my colleagues believe that this large increase in Atlantic major hurricanes is primarily due to the multi-decadal increase in the Atlantic Ocean Thermohaline Circulation (THC) that is driven by Atlantic salinity variations. These Atlantic multi-decadal changes have also been termed the Atlantic Multidecadal Oscillation (AMO). These increases are not a result of global surface temperatures or CO2 increases.
Although global surface temperatures have increased over the last century and over the last 30 years, there are now many observational studies which indicate there has not been any significant long term increase in hurricane frequency or intensity in any of the globe’s tropical cyclone basins.
Tracks of major (Category 3-4-5) hurricanes (seen in figure above) during the 25 year period of 1945-1969 when the globe was undergoing a weak cooling versus the 25-year period of 1970-1994 when the globe was undergoing a modest warming. CO2 amounts in the later period were approximately 18 percent higher than in the earlier period. Major Atlantic hurricane activity during the later period was only about one third of that of the earlier period despite warmer global temperatures. On a normalized basis major Hurricanes cause about 80-85 percent of all tropical cyclone spawned destruction.
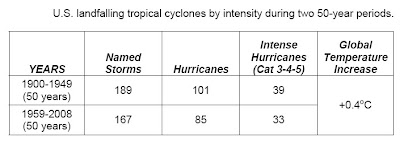
Technology developments have rendered long period over ocean hurricane observations unreliable. The most reliable long-period hurricane records we have are the measurements of US land falling tropical cyclones since 1900 (as in the Table above). Although global mean ocean and Atlantic sea surface temperatures have increased by about 0.4oC between the two 50-year periods of 1900-1949 and 1959-2008, the frequency of US landfall numbers actually shows a slight downward trend for the later period even though CO2 has gone up about 30 percent between these two periods.
…This downward trend is particularly noticeable for the US East Coast and Florida Peninsula where the difference in landfall of major (Category 3-4-5) hurricanes between the 43-year period of 1923-1965 (24 landfall events) and the 43-year period of 1966 2008 (7 landfall events) was especially large (as seen in the Figure above).
For the entire United States coastline, 39 major hurricanes made landfall during the earlier 43-year period (1923-1965) compared with only 22 for the latter 43-year period (1966-2008).
This downward landfall numbers occurred despite the fact that CO2 amounts were approximately 20 percent higher during the latter period compared with the earlier period (as seen in the Figure above). This figure illustrates that caution must be used when extrapolating trends into the future. Obviously, U.S. major hurricane landfalls will continue after 2050.
The active hurricane season in 2008 lends further support to the belief that the Atlantic basin remains in an active hurricane cycle associated with a strong thermohaline circulation and an active phase of the Atlantic Multidecadal Oscillation (AMO). This active cycle is expected to continue for another decade or two at which time we should enter a quieter Atlantic major hurricane period like we experienced during the quarter-century periods of 1970-1994 and 1901-1925. Atlantic hurricanes (particularly major hurricanes) go through multi-decadal cycles. Cycles in Atlantic major hurricanes have been observationally traced back to the mid-19th century, and changes in the AMO have been inferred from Greenland paleo ice-core temperature measurements going back thousand of years.
The influence of rises in atmospheric CO2 on hurricane activities is likely to be very small and within the noise level of our measurement capability or of any reliable numerical model output. There is no way of telling whether CO2 rises might have a miniscule positive or a miniscule negative effect on hurricane frequency or intensity. It would be unwise for our society to reduce atmospheric CO2 gases under the naïve belief that we would in any way be reducing the damage from these storms.
So what of 2009's Hurricane season?
So, where are all of the news stories about the fact we’ve had no tropical storms yet this year? As can be seen in the following graphic, as of this date in 2005 we already had 8 named storms in the Atlantic basin. And tomorrow, August 4, that number will increase to 9. In 2005 we were even told to expect more active hurricane seasons from now on because of global warming.
Of course, even though it is interesting that the 2009 tropical season is off to such a slow start, it may well have no significance in terms of long-term trends.
Of course this declining recent trend in Hurricane activity has led Dr. Michael Mann of Hockey Stick Graph, and Antarctic warming infamy to create another hockey stick graph for hurricanes: As discussed in this article: Mann hockey-sticks hurricanes: Hurricanes in the Atlantic are more frequent than at any time in the last 1,000 years.But he is not alone. The use of an image of Hurricane Katrina on the cover of “An Inconvenient Truth” left many with the impression that this was the largest hurricane ever recorded. You may recall this statement from Dr. Tim Flannery:
“As it has warmed over the past decade, the world has seen the most powerful El Nino ever recorded (1997-98), the most devastating hurricanes in 200 years (Mitch 1998, Katrina 2005), the hottest European summer on record (2003) and the first South Atlantic hurricane ever.”
But earlier we proved this statement to be flawed,when:
The US National Climatic Data Centre says “other storms have had stronger sustained winds when they made landfall’’, including one in 1935. It adds: “The most deadly hurricane to strike the US made landfall in Galveston, Texas, on September 8, 1900 . . . claiming more than 8000 lives.” Only a century ago.
So what is the largest and most destructive hurricanes and cyclones ever recorded and when did they occur?
The 22 Deadliest Tropical Cyclones in World History
Rank:- Name:- Areas of Largest Loss:- Year: - Ocean Area: - Deaths:-
1. Great Bhola Cyclone, Bangladesh 1970 Bay of Bengal 550,000
2. Hooghly River Cyclone, India and Bangladesh 1737 Bay of Bengal 350,000
3. Haiphong Typhoon, Vietnam 1881 West Pacific 300,000
4. Coringa, India 1839 Bay of Bengal 300,000
5. Backerganj Cyclone, Bangladesh 1584 Bay of Bengal 200,000
6. Great Backerganj Cyclone, Bangladesh 1876 Bay of Bengal 200,000
7. Chittagong, Bangladesh 1897 Bay of Bengal 175,000
8. Super Typhoon Nina, China 1975 West Pacific 171,000
9. Cyclone 02B, Bangladesh 1991 Bay of Bengal 140,000
10. Great Bombay Cyclone, India 1882 Arabian Sea 100,000
11. Hakata Bay Typhoon, Japan 1281 West Pacific 65,000
12. Calcutta, India 1864 Bay of Bengal 60,000
13. Swatlow, China 1922 West Pacific 60,000
14. Barisal, Bangladesh 1822 Bay of Bengal 50,000
15. Sunderbans coast, Bangladesh 1699 Bay of Bengal 50,000
16. Bengal Cyclone, Calcutta, India 1942 Bay of Bengal 40,000
17. Canton, China 1862 West Pacific 37,000
18. Backerganj (Barisal), Bangladesh 1767 Bay of Bengal 30,000
19. Barisal, Bangladesh 1831 Bay of Bengal 22,000
20. Great Hurricane, Lesser Antilles Islands 1780 Atlantic 22,000
21. Devi Taluk, SE India 1977 Bay of Bengal 20,000
22. Great Coringa Cyclone, India 1789 Bay of Bengal 20,000
Examining the list of years we find that only five are in the era where CO2 levels are rising due to industrialisation and of those only two are post 1976 where the temperature starts to rise towards it’s peak in 1998. Whilst it could be claimed that the death tolls prior to 1900 may be speculative and therefore so is the list, the fact remains that once again the data it shows, simply doesn’t fit the hype.


Very interesting reading, thanks. :)
ReplyDeleteThanks for that feedback Pearl, I hope you come back. Also, tell your friends to visit, the more the merrier.
ReplyDelete