Saturday, January 23, 2010

No Peer Review Required At IPCC

In a follow up to my posts on Climategate and Glaciergate(which the IPCC has issued a (sort of) apology for) is this article by Ben Pile on Dr. Roger Pielke Jr's website entitled: More Laundered Literature . In it he examines yet another example of the IPCC citing Non Peer Reviewed, non scientific research from a single source and presenting it as settled consensus science. The topic in question this time relates to a claim made by Oxfam in a published report claiming:

According to the IPCC, climate change could halve yields from rain-fed crops in parts of Africa as early as 2020, and put 50 million more people worldwide at risk of hunger. [Pg. 2]

Upon further investigation they found the following in the IPCC report:

In other [African] countries, additional risks that could be exacerbated by climate change include greater erosion, deficiencies in yields from rain-fed agriculture of up to 50% during the 2000-2020 period, and reductions in crop growth period (Agoumi, 2003). [IPCC WGII, Page 448. 9.4.4]

Oxfam cite the IPCC, but the citation belongs to Agoumi. The IPCC reference his study properly:

Agoumi, A., 2003: Vulnerability of North African countries to climatic changes: adaptation and implementation strategies for climatic change. Developing Perspectives on Climate Change: Issues and Analysis from Developing Countries and Countries with Economies in Transition. IISD/Climate Change Knowledge Network, 14 pp. (PDF).

There is only limited discussion of “deficiencies in yields from rain-fed agriculture” in that paper, and its focus is not ‘some’ African countries, but just three: Morocco, Tunisia, and Algeria. It is not climate research. It is a discussion about the possible effects of climate change. All that the report actually says in relation to the IPCC quote, is that,
Studies on the future of vital agriculture in the region have shown the following risks, which are linked to climate change:
• greater erosion, leading to widespread soil degradation;
• deficient yields from rain-based agriculture of up to 50 per cent during the 2000–2020 period;
• reduced crop growth period;
Most interestingly, the study was not simply produced by some academic working in some academic department, for publication in some peer-reviewed journal. Instead, it was published by The International Institute for Sustainable Development (IISD). According to the report itself,
The International Institute for Sustainable Development contributes to sustainable development by advancing policy recommendations on international trade and investment, economic policy, climate change, measurement and indicators, and natural resource management. By using Internet communications, we report on international negotiations and broker knowledge gained through collaborative projects with global partners, resulting in more rigorous research, capacity building in developing countries and better dialogue between North and South.
Oxfam takes its authority from the IPCC. The IPCC report seemingly takes its authority from a bullet point in a paper published by an organisation with a declared political interest in the sustainability agenda that was the brainchild of former Canadian Prime Minister Brian Mulroney in 1988.

That the IPCC is citing non-peer-reviewed, non-scientific research from quasi governmental semi-independent sustainability advocacy organisations must say something about the dearth of scientific or empirical research. The paper in question barely provides any references for its own claims, yet by virtue of merely appearing in the IPCC’s 2007 AR4 report, a single study, put together by a single researcher, becomes “consensus science”.

The situation is simply insane. The IPCC are cited as producers of official science, yet they often appear to take as many liberties with the sources they cite, as those who cite the IPCC – such as Oxfam – go on to do. To ask questions about this process is to stand against ‘the consensus’, to be a ‘denier’, and to be willingly jeopardising the future of millions of people, and inviting the end of the world.

The popular view of the climate debate and politics is that the IPCC and scientists produce the science, which politicians and policymakers respond to, encouraged by NGOs, all reported on by journalists. But as the seemingly unfounded claims about the Himalayan glaciers and the North African water shortages show, this is a misconception. Science, the media, government, NGOs and supra-national political organisations do not exist as sharply distinct institutions. They are nebulous and porous. They merge, and each influences the interpretation and substance of the next iteration of their own product. The distinction between science and politics breaks down in the miasma.

If this process could be mapped, it would be no surprise if it was discovered that the IPCC was found to be citing itself through citing NGOs and Quasi-NGOs, and other non-peer-reviewed, not scientific literature. This is the real climate feedback mechanism.

In addition to this is the latest revelation of IPCC misinformation via the U.K.'s TimesOnline website, entitled: UN wrongly linked global warming to natural disasters. In it it states:

The United Nations climate science panel faces new controversy for wrongly linking global warming to an increase in the number and severity of natural disasters such as hurricanes and floods.

It based the claims on an unpublished report that had not been subjected to routine scientific scrutiny — and ignored warnings from scientific advisers that the evidence supporting the link too weak. The report's own authors later withdrew the claim because they felt the evidence was not strong enough.

The claim by the Intergovernmental Panel on Climate Change (IPCC), that global warming is already affecting the severity and frequency of global disasters, has since become embedded in political and public debate. It was central to discussions at last month's Copenhagen climate summit, including a demand by developing countries for compensation of $100 billion (£62 billion) from the rich nations blamed for creating the most emissions.

...The new controversy also goes back to the IPCC's 2007 report in which a separate section warned that the world had "suffered rapidly rising costs due to extreme weather-related events since the 1970s".

It suggested a part of this increase was due to global warming and cited the unpublished report, saying: "One study has found that while the dominant signal remains that of the significant increases in the values of exposure at risk, once losses are normalised for exposure, there still remains an underlying rising trend."

The Sunday Times has since found that the scientific paper on which the IPCC based its claim had not been peer reviewed, nor published, at the time the climate body issued its report.

When the paper was eventually published, in 2008, it had a new caveat. It said: "We find insufficient evidence to claim a statistical relationship between global temperature increase and catastrophe losses."

Despite this change the IPCC did not issue a clarification ahead of the Copenhagen climate summit last month. It has also emerged that at least two scientific reviewers who checked drafts of the IPCC report urged greater caution in proposing a link between climate change and disaster impacts — but were ignored.

The claim will now be re-examined and could be withdrawn.

...The academic paper at the centre of the latest questions was written in 2006 by Robert Muir-Wood, head of research at Risk Management Solutions, a London consultancy, who later became a contributing author to the section of the IPCC's 2007 report dealing with climate change impacts. He is widely respected as an expert on disaster impacts.

Muir-Wood wanted to find out if the 8% year-on-year increase in global losses caused by weather-related disasters since the 1960s was larger than could be explained by the impact of social changes like growth in population and infrastructure.

...Muir-Wood was, however, careful to point out that almost all this increase could be accounted for by the exceptionally strong hurricane seasons in 2004 and 2005. There were also other more technical factors that could cause bias, such as exchange rates which meant that disasters hitting the US would appear to cost proportionately more in insurance payouts.

Despite such caveats, the IPCC report used the study in its section on disasters and hazards, but cited only the 1970-2005 results.

The IPCC report said: "Once the data were normalised, a small statistically significant trend was found for an increase in annual catastrophe loss since 1970 of 2% a year." It added: "Once losses are normalised for exposure, there still remains an underlying rising trend."

Muir-Wood's paper was originally commissioned by Roger Pielke, professor of environmental studies at Colorado University, also an expert on disaster impacts, for a workshop on disaster losses in 2006. The researchers who attended that workshop published a statement agreeing that so far there was no evidence to link global warming with any increase in the severity or frequency of disasters. Pielke has also told the IPCC that citing one section of Muir-Wood's paper in preference to the rest of his work, and all the other peer-reviewed literature, was wrong.

He said: "All the literature published before and since the IPCC report shows that rising disaster losses can be explained entirely by social change. People have looked hard for evidence that global warming plays a part but can't find it. Muir-Wood's study actually confirmed that."

More Information can be gotten directly from Dr. Roger Pielke Jr.'s blog. It would now appear that the lack of peer review uncovered by the Glaciergate disclosure is indeed widespread throughout the IPCC's 4th Assessment Report.

Despite this Professor Jean-Pascal van Ypersele, a climatologist at the Universite Catholique de Louvain in Belgium, who is vice-chair of the IPCC, said: "We are reassessing the evidence and will publish a report on natural disasters and extreme weather with the latest findings. Despite recent events the IPCC process is still very rigorous and scientific."

I'm not sure who the Professor is now trying to convince more, the increasingly sceptical public or himself.

Glaciergate And The TERI Link

It seems that Climategate wasn't the only scandal to develop over the last few months. The latest involves the rigorous peer reviewed science (or complete lack there of) the IPCC applied to its claim that Himalayan glaciers would completely disappear by 2035 or sooner if the current rate of melting due of course to man made global warming was to continue. Here is the quote from chapter 10 of the IPCC's 4thAssessment Report:

Glaciers in the Himalaya are receding faster than in any other part of the world (see Table 10.9) and, if the present rate continues, the likelihood of them disappearing by the year 2035 and perhaps sooner is very high if the Earth keeps warming at the current rate. Its total area will likely shrink from the present 500,000 to 100,000 km2 by the year 2035 (WWF, 2005).

This was used at both governmental and non-governmental level as a reason to justify introducing Emissions Trading. As can be seen here for both the Garnaut Report and Government white paper responses and here for Australian Religious Response to Climate Change as an example of a non governmental one.

In addition to this new scandal is another involving the relationship of the IPCC"s top climate official Dr Rajendra Pachauri (who I have written about before) has with The Energy and Resources Institute (TERI), based in New Delhi, which is India's most influential private body involved in climate-change issues and renewable energy and the millions of dollars he is apparently making by incorporating both his role as a top climate official with business opportunities that he can direct TERI's way in that capacity.

Let's first look at the new scandal known as Glaciergate:

From an article (one of many that have now been written on this) from the U.K.'s Express newspaper is this explanation:

FRESH doubts were cast over controversial global warming theories yesterday after a major climate change argument was discredited.

The International Panel on Climate Change was forced to admit its key claim that Himalayan glaciers would melt by 2035 was lifted from a 1999 magazine article. The report was based on an interview with a little-known Indian scientist who has since said his views were “speculation” and not backed up by research.

It was also revealed that the IPCC’s controversial chairman, Dr Rajendra Pachauri, described as “the world’s top climate scientist”, is a former railway engineer with a PhD in economics and no formal climate science qualifications.

Dr Pachauri was yesterday accused of a conflict of interest after it emerged he has a network of business interests that attract millions of pounds in funding thanks to IPCC policies. One of them, The Energy Research Institute, has a London office and is set to receive up to £10million from British taxpayers over the next five years in the form of grants from the Department for International Development.

Dr Pachauri denies any conflict of interest arising from his various roles.

Yesterday, critics accused the IPCC of boosting the man-made global warming theory to protect a multi-million pound industry.

Climate scientist Peter Taylor said: “I am not surprised by this news. A vast bureaucracy and industry has been built up around this theory. There is too much money in it for the IPCC to let it wither.”

Professor Julian Dowdeswell, a glacier specialist at Cambridge University, said: “The average glacier is 1,000ft thick so to melt one even at 15ft a year would take 60 years. That is a lot faster than anything we are seeing now so the idea of losing it all by 2035 is unrealistically high.”

The IPCC was set up by the UN to ensure world leaders had the best possible scientific advice on climate change. It issued the glacier warning in a benchmark report in 2007 that was allegedly based on the latest research into global warming.

The scientists behind the report now admit they relied on a news story published in the New Scientist journal in 1999. The article was based on a short telephone interview with scientist Syed Hasnain, then based in Delhi, who has since said his views were “speculation”.

The New Scientist report was picked up by the WWF and included in a 2005 paper.

It then became a key source for the IPCC which went further in suggesting the melting of the glaciers was “very likely”.

Yesterday, Professor Murari Lal who oversaw the chapter on glaciers in the IPCC report, said: “If Hasnain says officially that he never asserted this, or that it is a wrong presumption, then I will recommend that the assertion about Himalayan glaciers be removed from future IPCC assessments.”

Last year the Indian government issued its own scientific research rejecting the notion that glaciers were melting so rapidly.

Before the weakness in the IPCC’s research was exposed, Dr Pachauri dismissed the Indian government report as “voodoo science”.

The revelations are the latest crack to appear in the scientific consensus on climate change.

It follows the so-called climate-gate scandal in November last year when leaked emails from the University of East Anglia’s Climatic Research Unit appeared to show scientists fiddling the figures to strengthen the case for man-made climate change.

The scandal prompted critics to suggest that many scientists had a vested interest in promoting climate change because it helped secure more funding for research.....

So what we have instead of a rigorous peer review process is a journalist interviewing a scientist who gives a wildly speculative view on a topic. This journalist prints this speculation as fact in New Scientist magazine. This is then picked up by the WWF (note that they are the sited source by the IPCC in the quote given above from the 4th AR) who wrote:

glaciers in the Himalayas are receding faster than in any other part of the world and, if the present rate continues, the livelihood[sic] of them disappearing by the year 2035 is very high

From there we have the IPCC disregarding any rigorous peer review process and incorporating it as "fact" and "settled science" into their 4th Assessment Report. Yet we were constantly told that the IPCC is the "gold standard" for climate science and all of its science is peer reviewed. Apparently not! Dr. Joanne Nova has a good summary of this and other areas the IPCC has missed the golden mark as can be seen here.

As we saw in the original article I referenced in this section was this quote:

Dr Pachauri was yesterday accused of a conflict of interest after it emerged he has a network of business interests that attract millions of pounds in funding thanks to IPCC policies.

The original article by Christopher Booker and Richard North of the U.K. Telegraph says:

No one in the world exercised more influence on the events leading up to the Copenhagen conference on global warming than Dr Rajendra Pachauri, chairman of the UN’s Intergovernmental Panel on Climate Change (IPCC) and mastermind of its latest report in 2007.

Although Dr Pachauri is often presented as a scientist (he was even once described by the BBC as “the world’s top climate scientist”), as a former railway engineer with a PhD in economics he has no qualifications in climate science at all.

What has also almost entirely escaped attention, however, is how Dr Pachauri has established an astonishing worldwide portfolio of business interests with bodies which have been investing billions of dollars in organisations dependent on the IPCC’s policy recommendations.

These outfits include banks, oil and energy companies and investment funds heavily involved in ‘carbon trading’ and ‘sustainable technologies’, which together make up the fastest-growing commodity market in the world, estimated soon to be worth trillions of dollars a year.

Today, in addition to his role as chairman of the IPCC, Dr Pachauri occupies more than a score of such posts, acting as director or adviser to many of the bodies which play a leading role in what has become known as the international ‘climate industry’.

It is remarkable how only very recently has the staggering scale of Dr Pachauri’s links to so many of these concerns come to light, inevitably raising questions as to how the world’s leading ‘climate official’ can also be personally involved in so many organisations which stand to benefit from the IPCC’s recommendations.

...The original power base from which Dr Pachauri has built up his worldwide network of influence over the past decade is the Delhi-based Tata Energy Research Institute, of which he became director in 1981 and director-general in 2001. Now renamed The Energy Research Institute, TERI was set up in 1974 by India’s largest privately-owned business empire, the Tata Group, with interests ranging from steel, cars and energy to chemicals, telecommunications and insurance (and now best-known in the UK as the owner of Jaguar, Land Rover, Tetley Tea and Corus, Britain’s largest steel company).

Although TERI has extended its sponsorship since the name change, the two concerns are still closely linked.

In India, Tata exercises enormous political power, shown not least in the way that when it expressed its interests in developing land in the eastern states of Orissa and Jarkhand, it led to the Indian government displacing hundreds of thousands of poor tribal villagers to make way for large-scale iron mining and steelmaking projects.

Initially, when Dr Pachauri took over the running of TERI in the 1980s, his interests centred on the oil and coal industries, which may now seem odd for a man who has since become best known for his opposition to fossil fuels. He was, for instance, a director until 2003 of India Oil, the country’s largest commercial enterprise, and until this year remained as a director of the National Thermal Power Generating Corporation, its largest electricity producer.

In 2005, he set up GloriOil, a Texas firm specialising in technology which allows the last remaining reserves to be extracted from oilfields otherwise at the end of their useful life.

However, since Pachauri became a vice-chairman of the IPCC in 1997, TERI has vastly expanded its interest in every kind of renewable or sustainable technology, in many of which the various divisions of the Tata Group have also become heavily involved, such as its project to invest $1.5 billion (£930 million) in vast wind farms.

Dr Pachauri’s TERI empire has also extended worldwide, with branches in the US, the EU and several countries in Asia. TERI Europe, based in London, of which he is a trustee (along with Sir John Houghton, one of the key players in the early days of the IPCC and formerly head of the UK Met Office) is currently running a project on bio-energy, financed by the EU.

Another project, co-financed by our own Department of Environment, Food and Rural Affairs and the German insurance firm Munich Re, is studying how India’s insurance industry, including Tata, can benefit from exploiting the supposed risks of exposure to climate change. Quite why Defra and UK taxpayers should fund a project to increase the profits of Indian insurance firms is not explained.

Even odder is the role of TERI’s Washington-based North American offshoot, a non-profit organisation, of which Dr Pachauri is president. Conveniently sited on Pennsylvania Avenue, midway between the White House and the Capitol, this body unashamedly sets out its stall as a lobbying organisation, to “sensitise decision-makers in North America to developing countries’ concerns about energy and the environment”.

TERI-NA is funded by a galaxy of official and corporate sponsors, including four branches of the UN bureaucracy; four US government agencies; oil giants such as Amoco; two of the leading US defence contractors; Monsanto, the world’s largest GM producer; the WWF (the environmentalist campaigning group which derives much of its own funding from the EU) and two world leaders in the international ‘carbon market’, between them managing more than $1 trillion (£620 billion) worth of assets.

All of this is doubtless useful to the interests of Tata back in India, which is heavily involved not just in bio-energy, renewables and insurance but also in ‘carbon trading’, the worldwide market in buying and selling the right to emit CO2. Much of this is administered at a profit by the UN under the Clean Development Mechanism (CDM) set up under the Kyoto Protocol, which the Copenhagen treaty was designed to replace with an even more lucrative successor.

...It is one of these deals, reported in last week’s Sunday Telegraph, which is enabling Tata to "mothball" nearly three million tonnes of steel production at its Corus plant in Redcar, while opening a new plant in Orissa with a similar scale of production, gaining in the process a potential £1.2 billion in ‘carbon credits’ (while putting 1,700 people on Teesside out of work).

More than three-quarters of the world ‘carbon’ market benefits India and China in this way. India alone has 1,455 CDM projects in operation, worth $33 billion (£20 billion), many of them facilitated by Tata – and it is perhaps unsurprising that Dr Pachauri also serves on the advisory board of the Chicago Climate Exchange, the largest and most lucrative carbon-trading exchange in the world, which was also assisted by TERI in setting up India’s own carbon exchange.

But this is peanuts compared to the numerous other posts to which Dr Pachauri has been appointed in the years since the UN chose him to become the world’s top ‘climate-change official’.

In 2007, for instance, he was appointed to the advisory board of Siderian, a San Francisco-based venture capital firm specialising in ‘sustainable technologies’, where he was expected to provide the Fund with ‘access, standing and industrial exposure at the highest level’,

In 2008 he was made an adviser on renewable and sustainable energy to the Credit Suisse bank and the Rockefeller Foundation. He joined the board of the Nordic Glitnir Bank, as it launched its Sustainable Future Fund, looking to raise funding of £4 billion. He became chairman of the Indochina Sustainable Infrastructure Fund, whose CEO was confident it could soon raise £100 billion.

In the same year he became a director of the International Risk Governance Council in Geneva, set up by EDF and E.On, two of Europe’s largest electricity firms, to promote ‘bio-energy’. This year Dr Pachauri joined the New York investment fund Pegasus as a ‘strategic adviser’, and was made chairman of the advisory board to the Asian Development Bank, strongly supportive of CDM trading, whose CEO warned that failure to agree a treaty at Copenhagen would lead to a collapse of the carbon market.

The list of posts now held by Dr Pachauri as a result of his new-found world status goes on and on. He has become head of Yale University’s Climate and Energy Institute, which enjoys millions of dollars of US state and corporate funding. He is on the climate change advisory board of Deutsche Bank. He is Director of the Japanese Institute for Global Environmental Strategies and was until recently an adviser to Toyota Motors. Recalling his origins as a railway engineer, he is even a policy adviser to SNCF, France’s state-owned railway company.

Meanwhile, back home in India, he serves on an array of influential government bodies, including the Economic Advisory Committee to the prime minister, holds various academic posts and has somehow found time in his busy life to publish 22 books.

...But the real question mark over TERI’s director-general remains over the relationship between his highly lucrative commercial jobs and his role as chairman of the IPCC.

TERI have, for example, become a preferred bidder for Kuwaiti contracts to clean up the mess left by Saddam Hussein in their oilfields in 1991. The $3 billion (£1.9 billion) cost of the contracts has been provided by the UN. If successful, this would be tenth time TERI have benefited from a contract financed by the UN.

Certainly no one values the services of TERI more than the EU, which has included Dr Pachauri’s institute as a partner in no fewer than 12 projects designed to assist in devising the EU’s policies on mitigating the effects of the global warming predicted by the IPCC.

In a very convenient and no doubt profitable arrangement Dr. Pachauri and TERI are now "cleaning up" around the world. There are even reports that Dr. Pachauri used his TERI email account to conduct official IPCC business furthering the calls of "Conflict of Interest."

Dr. Pachauri responded to the Booker/North article as can be seen in this follow up article by Christopher Booker:

In a series of press and television interviews, Dr Pachauri described our report as "a pack of lies". He accused us of being part of that same "powerful vested interest" responsible for "Climategate", the emails and other documents leaked from the East Anglia Climatic Research Unit, which revealed the methods used by the small group of scientists at the heart of the IPCC to manipulate temperature data to show that the earth has been warming further than is justified by the evidence.

When asked whether he intended to take legal action over our article, Dr Pachauri replied that he hadn't yet made up his mind.

In typical fashion of an alarmist note Dr. Pachauri's instinctive reaction to criticism: to deny and abuse but not to fight back with facts.

Sunday, January 17, 2010

Those Who Control The Information Try To Control The Debate.

The rise and exposure of Climategate did more than just show the email correspondence of a few climate scientists who were determined to shut down dissent, manipulate the peer review process hide or destroy information requested under FOI, hide their mistakes, etc, etc. They also exposed the bias of information sources like Wikipedia (as we have seen before), as well as exposing the bias of Google as a web browser. National Post journalist Lawrence Solomon investigated these phenomenon and this is what he found: In the first article entitled Wikipedia's Climate Doctor we find:

The Climategate Emails describe how a small band of climatologists cooked the books to make the last century seem dangerously warm.

...The Climategate Emails reveal something else, too: the enlistment of the most widely read source of information in the world — Wikipedia — in the wholesale rewriting of this history.

...But the UN’s official verdict that the Medieval Warm Period had not existed did not erase the countless schoolbooks, encyclopedias, and other scholarly sources that claimed it had. Rewriting those would take decades, time that the band members didn’t have if they were to save the globe from warming. Instead, the band members turned to their friends in the media and to the blogosphere, creating a website called RealClimate.org. “The idea is that we working climate scientists should have a place where we can mount a rapid response to supposedly ‘bombshell’ papers that are doing the rounds” in aid of “combating dis-information,” one email explained, referring to criticisms of the hockey stick and anything else suggesting that temperatures today were not the hottest in recorded time. One person in the nine-member Realclimate.org team — U.K. scientist and Green Party activist William Connolley — would take on particularly crucial duties. Connolley took control of all things climate in the most used information source the world has ever known – Wikipedia. Starting in February 2003, just when opposition to the claims of the band members were beginning to gel, Connolley set to work on the Wikipedia site. He rewrote Wikipedia’s articles on global warming, on the greenhouse effect, on the instrumental temperature record, on the urban heat island, on climate models, on global cooling. On Feb. 14, he began to erase the Little Ice Age; on Aug.11, the Medieval Warm Period. In October, he turned his attention to the hockey stick graph. He rewrote articles on the politics of global warming and on the scientists who were skeptical of the band. Richard Lindzen and Fred Singer, two of the world’s most distinguished climate scientists, were among his early targets, followed by others that the band especially hated, such as Willie Soon and Sallie Baliunas of the Harvard-Smithsonian Center for Astrophysics, authorities on the Medieval Warm Period. All told, Connolley created or rewrote 5,428 unique Wikipedia articles. His control over Wikipedia was greater still, however, through the role he obtained at Wikipedia as a website administrator, which allowed him to act with virtual impunity. When Connolley didn’t like the subject of a certain article, he removed it — more than 500 articles of various descriptions disappeared at his hand. When he disapproved of the arguments that others were making, he often had them barred — over 2,000 Wikipedia contributors who ran afoul of him found themselves blocked from making further contributions. Acolytes whose writing conformed to Connolley’s global warming views, in contrast, were rewarded with Wikipedia’s blessings. In these ways, Connolley turned Wikipedia into the missionary wing of the global warming movement. The Medieval Warm Period disappeared, as did criticism of the global warming orthodoxy. With the release of the Climategate Emails, the disappearing trick has been exposed. The glorious Medieval Warm Period will remain in the history books, perhaps with an asterisk to describe how a band of zealots once tried to make it disappear.

This was followed up by the article entitled
Climategate at Wikipedia in which he further highlights:

Since my Saturday column described how Wikipedia editors have been feverishly rewriting climate history over much of the decade, fair-minded Wikipedians have been doing their best to correct the record. No sooner than they remove gross distortions, however, than the distortions are replaced. William Connolley, a Climategate member and Wikipedia’s chief climate change propagandist, remains as active as ever.


How does Wikipedia work and how does Connolley and his co-conspirators exercise control? Take Wikipedia’s page for Medieval Warm Period, as an example. In the three days following my column’s appearance, this page alone was changed some 50 times in battles between Connolley’s crew and those who want a fair presentation of history.

One of the battles concerns the so-called hockey stick graphs, which purport to show that temperatures over the last 2000 years were fairly stable until the last century, when temperatures rose rapidly to today’s supposedly dangerous and unprecedented levels. In these graphs, the Medieval Warm Period – a period of several centuries around the year 1000 – appears to be a modest bump along the way. Before the hockey stick graphs began to be published about a decade ago, scientists everywhere – including those associated with the UN itself – viewed the Medieval Warm Period as much hotter than today. Rather than appearing as a modest bump compared to today’s high temperatures, the Medieval Warm Period looked more like a mountain next to the molehill that is today’s temperature increase.

The hockey stick graphs led to an upheaval in scientific understanding when the UN reversed itself and declared them bona fide. Soon after, the hockey stick graphs were shown to be bogus by a blue-chip panel of experts assembled by the US Congress. The Climategate Emails confirm the blue-chip panel’s assessment – we now know that Climategate scientists themselves doubted the reliability of the hockey stick graphs.

With the hockey stick graphs so thoroughly discredited, you’d think they would become a footnote to a discussion of the Medieval Warm Period, or an object of amusement and curiosity. But no, on the Wikipedia page for the Medieval Warm Period, the hockey stick graph appears prominently at the top, as if it is settled science.

Because the hockey stick graph has become an icon of deceit and in no way an authority worthy of being cited, fair-minded Wikipedians tried to remove the graph from the page, as can be seen here. Exactly two minutes later, one of Connelley’s associates replaced the graph, restoring the page to Connelley’s original version, as seen here.

Battles like this occurred on numerous fronts, until just after midnight on Dec 22, when Connolley reimposed his version of events and, for good measure, froze the page to prevent others from making changes -- and to prevent the public, even in two-minute windows, from realizing that today’s temperatures look modest in comparison to those in the past. In the World of Wikipedia, seen as here, the hockey stick graph, and Connolley’s version of history, still rules.


This bias by Wikipedia was not isolated. In fact the Google readjustment (read hiding) of the
number of articles referring to Climategate became known as "Googlegate," such was the level of interference. In Solomon's article Better off with Bing he writes:

This week, Google announced an end to its long-standing collaboration with the Chinese Communists — it will no longer censor users inside China.


That’s good of it. Maybe Google will now also stop using its search engine to censor the rest of us, in the Western countries.

Search for “Googlegate” on Google and you’ll get a paltry result (my result yesterday was 29,300). Search for “Googlegate” on Bing, Microsoft’s search engine competitor, and the result numbers an eye-popping 72.4 million. If you’re a regular Google user, as opposed to a Bing user, you might not even know that “Googlegate” has been a hot topic for years in the blogosphere — that’s the power that comes of being able to control information.

Saturday, January 16, 2010

Cloud Mystery Video Series

In an earlier post I made reference to a series of videos called the cloud mystery and I showed you the preview to it. Well I have since discovered the full six part series and will post it here for you to view:

Part 1


Part 2


Part 3


Part 4


Part 5


Part6


They are thought provoking and worth a watch. They are also a companion to this report written by Dr. Roy Spencer of UAH entitled: Clouds Dominate CO2 as a Climate Driver Since 2000. In it he says:

The main point I am making here is that, no matter whether you assume the climate system is sensitive or insensitive, our best satellite measurements suggest that the climate system is perfectly capable of causing internally-generated radiative forcing larger than the “external” forcing due to increasing atmospheric carbon dioxide concentrations. Low cloud variations are the most likely source of this internal radiative forcing.

... If one additionally entertains the possibility that there is still considerable “warming still in the pipeline” left from increasing CO2, as NASA’s Jim Hansen claims, then the need for some natural cooling mechanism to offset and thus produce no net warming becomes even stronger. Either that, or the climate system is so insensitive to increasing CO2 that there is essentially no warming left in the pipeline to be realized. (The less sensitive the climate system, the faster it reaches equilibrium when forced with a radiative imbalance.)

Any way you look at it, the evidence for internally-forced climate change is pretty clear. Based upon this satellite evidence alone, I do not see how the IPCC can continue to ignore internally-forced variations in the climate system. The evidence for its existence is there for all to see, and in my opinion, the IPCC’s lack of diagnostic skill in this matter verges on scientific malpractice.

Wednesday, January 13, 2010

Australian Bureau of Meteorology (BoM) dismisses what it should be revealing

If you thought that the Australian Bureau of Meteorology was an independent entity and not deeply involved with the Climategate scandal, then you might want toread the following.
From the Australian Bureau of Meteorology (BoM) is this defence of the Climategate emails:

Emails stolen from the Climatic Research Unit of the University of East Anglia

There is clear evidence that our climate is changing, largely due to anthropogenic greenhouse gases. The Fourth Assessment Report (AR4), produced by the Intergovernmental Panel on Climate Change (IPCC) in 2007, states that global warming is ‘unequivocal’ and that ‘most of the observed increase in globally-averaged temperatures since the mid-20th century is very likely due to the observed increase in greenhouse gas concentrations’.

The AR4 draws on multiple lines of evidence from many independent institutions to show the Earth's climate system is warming. These include increases in global average air and ocean temperatures, widespread melting of snow and ice, and rising global average sea level. The AR4 represents the international consensus on climate change science and is based on all relevant scientific literature that has been peer-reviewed. All reports of the IPCC are also subjected to extensive expert and government review.

The emails and text files stolen from the University of East Anglia (UEA) Climate Research Unit (CRU) do not undermine the conclusions of the IPCC AR4. The UEA has announced that Sir Muir Russell, former Principal and Vice-Chancellor of the University of Glasgow, will head an independent review into allegations made against the CRU arising from the stolen emails. To date there is no evidence that the so-called ‘climategate’ emails will require any findings on which the IPCC AR4 conclusions are based to be revised. CRU's published research is, and has always been, fully peer-reviewed by the relevant journals, and is only one strand of research underpinning the strong consensus that human activity is affecting the world's climate in ways that are potentially dangerous.

The UEA (in collaboration with the Hadley Centre) is one of three lead agencies that compile global surface temperature estimates. The other two agencies are the NASA Goddard Institute for Space Studies and the US NOAA National Climatic Data Centre. All data sets show very similar trends in temperature since 1850, with a strong warming trend evident from 1970. These instrumental records of air temperature are consistent with independent records showing rising sea levels, ocean warming and reduced snow and ice.

Where they say "To date there is no evidence that the so-called ‘climategate’ emails will require any findings on which the IPCC AR4 conclusions are based to be revised." The BoM has obviously missed that they reveal is perhaps the greatest scientific scandal of our time - a conspiracy by a select few warmist scientists to politicise the debate, fudge statistics, sack sceptical scientists, block the release of data to prevent checking, illegally destroy data, deceive reporters, censor sceptical papers, manipulate the peer review process so only they get to say which papers are accepted and which are not, and finally hide errors in their work. This is not only unscientific but in some cases illegal, yet the BoM claims there is "no evidence" that the emails will cause any revision of the IPCC's AR4.

This is not surprising, however, when you visit their section on climate change and see just how uncritical and willing they are to promote the warmist point of view of the subject. Which is further reinforced when you visit the section on Science - facts and fiction where they readily ignore the facts and happily promote much of the warmist fiction.

But the most obvious reason for their dismissal of the Climategate scandal becomes obvious when you look at the section on About the Global Temperature Trend Maps particularly the sections on Data used and Further information

So, who's data was used?


The trend analyses use the Climatic Research Unit HadCRUT2v global gridded (5x5 degree resolution) temperature data set. These data are the blended near land surface temperature and sea surface temperature anomalies from the 1961-90 reference period. The data are publically available from the
Climatic Research Unit (CRU) . The CRU website also includes a full description of this data. A list of relevant scientific papers relating to the HadCRUT2v dataset is also provided below.

Please note that any use of these analyses should be acknowledged to the Bureau of Meteorology. Apart from the purposes of study, research, criticism and review, no part of these data may be reproduced, or redistributed for any commercial purposes, or distributed to a third party for such purpose, without written permission from the Director of Meteorology.

In the section on Further information we see some very familiar names popping up:

Braganza K., Karoly D.J., Hirst A.C., Mann M.E., Stott P.A., Stouffer R.J., Tett, S.F.B. 2003. Simple indices of global climate variability and change: Part I, variability and correlation structure. Climate Dynamics 20 491-502. DOI: 10.1007/s00382- 002-0286-0.

Christy, J.R., Parker, D.E., Stendel. M. and Norris, W.B., 2001. Differential trends in tropical sea surface temperature and atmospheric temperatures since 1979. Geophysical Research Letters 28, 183-186.

Folland, C.K., Rayner, N.A., Brown, S.J., Smith, T.M., Shen, S.S.P., Parker, D.E., Macadam, I., Jones, P.D., Jones, R.N., Nicholls, N. and Sexton, D.M.H., 2001a. Global temperature change and its uncertainties since 1861. Geophysical Research Letters 28, 2621-2624.

Folland, C.K., Karl, T.R., Christy, J.R., Clarke, R.A., Gruza, G.V., Jouzel, J., Mann, M.E., Oerlemans, J., Salinger, M.J. and Wang, S.-W., 2001b: Observed Climate Variability and Change. pp. 99-181 In: Climate Change 2001: The Scientific Basis. Contribution of Working Group I to the Third Assessment Report of the Intergovernmental Panel on Climate Change (Houghton, J.T., Ding, Y., Griggs, D.J., Noguer, M., van der Linden, P.J., Dai, X., Maskell, K. and Johnson, C.A. Eds.). Cambridge University Press, Cambridge, UK, 881pp.

Jones, P.D., Osborn, T.J. and Briffa, K.R., 1997. Estimating sampling errors in large-scale temperature averages. Journal of Climate 10, 2548-2568.

Jones, P.D., New, M., Parker, D.E., Martin, S. and Rigor, I.G., 1999. Surface air temperature and its variations over the last 150 years. Reviews of Geophysics 37, 173-199.

Jones, P.D., Osborn, T.J., Briffa, K.R., Folland, C.K., Horton, B., Alexander, L.V., Parker, D.E. and Rayner, N.A., 2001. Adjusting for sampling density in grid-box land and ocean surface temperature time series. Journal of Geophysical Research 106, 3371-3380.

Jones, P.D. and Moberg, A., 2003. Hemispheric and large-scale surface air temperature variations: An extensive revision and an update to 2001. Journal of Climate 16, 206-223.

Parker, D.E., Alexander, L.V. and Kennedy, J., 2004. Global and regional climate in 2003. Weather, 59, 145-152.

Rayner, N.A., Parker, D.E., Horton, E.B., Folland, C.K., Alexander, L.V, Rowell, D.P., Kent, E.C. and Kaplan, A., 2003. Globally complete analyses of sea surface temperature, sea ice and night marine air temperature, 1871-2000. Journal of Geophysical Research 108, 4407, doi 10.1029/2002JD002670

Is then any wonder they are so keen to defend their "friends" from this criticism and have the public believe that there is nothing of any importance to see here.

Let us also examine the statement from the BoM about "The AR4 draws on multiple lines of evidence from many independent institutions to show the Earth's climate system is warming. These include increases in global average air and ocean temperatures, widespread melting of snow and ice, and rising global average sea level."

May be their "blinkers on" approach to science has allowed them to miss these facts about:

Global average air temperatures. Of course if they are only going to rely on the "heavily adjusted" HadCRUT, GISS or NCDC datasets instead of the far more accurate UAH or RSS satellite information, that would better suit a warmist political agenda and secure long term funding.

Ocean Temperatures. Again if they prefer to use the NOAA datasets that deliberately do not include the inconvenient yet highly accurate Argo Buoy information, this too would suit a political aim to prove that warming is occurring instead of showing that it is not.

Widespread melting of snow and ice. That would include these growing glaciers, this growing sea ice in Antarctica and this 26% increase in sea ice in the Arctic from it's 2007 low.

Rising average global sea level. Not according to this data set or indeed this data set which show a levelling off of any sea level rise for at least the the last 4 to 5 years.

So one can only assume that the BoM is indeed being directly influenced in the handling and interpretation of these data sets by elements of the CRU or alike and that is why they are so keen to provide such appalling misinformation on the Climategate emails.

Hiding The Decline - Part 6

Russia it seems fair no better when it comes to the CRU team, if anything is is considerably worse than most countries with accusations that the CRU not only tampered with the data but also that they deliberately cherry picked the warmest weather stations to include in their data set.

This Climategate email from Michael Mann that is relevant:

Recently rejected two papers (one for JGR and for GRL) from people saying CRU has it wrong over Siberia. Went to town in both reviews, hopefully successfully. If either appears I will be very surprised, but you never know with GRL.

Demonstrating another classic case of climate bullying by "the team."

So what was it that Dr. Mann was so keen to protect?

In this article by Jeff ID of the Air Vent Blog, entitled: Russia Accuses CRU of Tampering he states:

It’s true, and it’s huge. Today another example of CRU having their foot on the scale, Russian papers are reporting that the Russian surface station data was sorted by CRU to use the highest warming stations only.

The article is linked here:

Russia affected by Climategate

A discussion of the November 2009 Climatic Research Unit e-mail hacking incident, referred to by some sources as “Climategate,” continues against the backdrop of the abortive UN Climate Conference in Copenhagen (COP15) discussing alternative agreements to replace the 1997 Kyoto Protocol that aimed to combat global warming.

The incident involved an e-mail server used by the Climatic Research Unit (CRU) at the University of East Anglia (UEA) in Norwich, East England. Unknown persons stole and anonymously disseminated thousands of e-mails and other documents dealing with the global-warming issue made over the course of 13 years.

Controversy arose after various allegations were made including that climate scientists colluded to withhold scientific evidence and manipulated data to make the case for global warming appear stronger than it is.

Climategate has already affected Russia. On Tuesday, the Moscow-based Institute of Economic Analysis (IEA) issued a report claiming that the Hadley Center for Climate Change based at the headquarters of the British Meteorological Office in Exeter (Devon, England) had probably tampered with Russian-climate data.

The IEA believes that Russian meteorological-station data did not substantiate the anthropogenic global-warming theory.

Analysts say Russian meteorological stations cover most of the country’s territory, and that the Hadley Center had used data submitted by only 25% of such stations in its reports.

Over 40% of Russian territory was not included in global-temperature calculations for some other reasons, rather than the lack of meteorological stations and observations.

The data of stations located in areas not listed in the Hadley Climate Research Unit Temperature UK (HadCRUT) survey often does not show any substantial warming in the late 20th century and the early 21st century.

The HadCRUT database includes specific stations providing incomplete data and highlighting the global-warming process, rather than stations facilitating uninterrupted observations.

On the whole, climatologists use the incomplete findings of meteorological stations far more often than those providing complete observations.

IEA analysts say climatologists use the data of stations located in large populated centers that are influenced by the urban-warming effect more frequently than the correct data of remote stations.

The scale of global warming was exaggerated due to temperature distortions for Russia accounting for 12.5% of the world’s land mass. The IEA said it was necessary to recalculate all global-temperature data in order to assess the scale of such exaggeration.

Global-temperature data will have to be modified if similar climate-date procedures have been used from other national data because the calculations used by COP15 analysts, including financial calculations, are based on HadCRUT research.

They specifically state that lack of measurement is not the cause. If they claim the full set of Russian data does NOT support global warming, imagine how different the bright red dot over Russia would look. Again the accusation is completely believable, yet is completely unverifiable because CRU has refused to release the data. This data and code release is the subject of illegal blocking of FOIA’s is one of the keys in the Climategate emails. We need to know the list of stations used and we must have copies of the raw data.

This is a very powerful accusation, which if true could change much about the climate science debate. Many papers are based on this dataset which has the highest trend of the major ground datasets.

So the deception provided by the CRU team is seen completely around the globe. Yet some still say that Climategate is not an issue and that the data so heavily relied upon by the world's major decision makers is still sound. Perhaps they need to review that further.

Tuesday, January 12, 2010

Hiding The Decline - Part 5

In an article by Dr. Richard Keen of the University of Colorado entitled: Alaska Climate – Station Data vs Adjusted GHCN/IPCC he looks at the the observed trends versus the adjusted data from the CRU for the IPCC and finds a familiar rising and unjustified temperature change in the IPCC's graphs:

I recently completed a study of central Alaska's climate. For this study I computed the average annual temperature for nine long-term Alaskan stations (and station combinations), which are: Eagle/Dawson, Ft. Yukon/Central, Fairbanks University, McKinley Park, Talkeetna, Gulkana/Kennecott/Chitina/McCarthy, Yakutat, Cordova, and Valdez. Then I averaged the nine stations for a regional mean. The data source was NCDC.


The annual values on the next plot clearly show the dominance of the PDO in Alaskan climate. For comparison with the IPCC thumbnail for Alaska (I hope you can find an enlarged version of this), I replotted the regional temperatures as ten-year averages.


My averages show that the past three decades have shown no warming (since the PDO shift in 1977), and are in fact no warmer than the 1935-1944 decade. This is very different from the IPCC which shows a substantial warming over the past three decades.
See the plot of annual versus the PDO stages.

Here is the GHCN annual temperatures for the same region. The GHCN data is dominated by an upward trend. My analysis gives an upward linear trend of 0.69 C/century (due to starting during a cold PDO and ending during a warm PDO), while the GHCN trend is 2.83 C/century - over 2 degrees larger!


Here is a blow up of the IPCC graph for Alaska.


My study and the GHCN use the same stations, because there are no other long-term stations in the regions. I applied no "corrections" beyond offsets used when combining two or more stations with overlapping records (no other adjustments were warranted). One can only guess what "corrections" were applied to the GHCN and IPCC data sets, but I can easily guess their magnitude - about 1 degree. Curiously, the magnitude of the adjustments is about the same as the "global warming" signal of the past century.

Dr. Richard Keen later wrote another article entitled:A Chilly December at the 700mb Level about the decline in recent temperatures in Coal Creek Canyon in Colorado, which is NW of Denver. In it he shows how this is an example of how one station’s data can be significant for assessing climate change, but only if the station is carefully installed and maintained, is in a location relatively free of non-climatic influences, has records that are diligently kept, and, above all, does not have its records mysteriously altered, as opposed to one tree from one location that fits a predetermined outcome becoming the standard for world temperature.

December was a chilly month across much of the U.S., and at my site (the NWS co-op station for Coal Creek Canyon, Colorado, NW of Denver at an elevation 8950 feet, or 720 millibars, December was the coldest December (and the coldest month of any name) in 27 years of record. The average of 16.5 was 0.8 degrees colder than December 1983. Over the entire record, nine months averaged colder than 20F; of these, five occurred during 1983-1990, none during 1991-2005, and four during 2007-2009. It appears that he warm spell of the 1990’s and early 2000’s has ended.

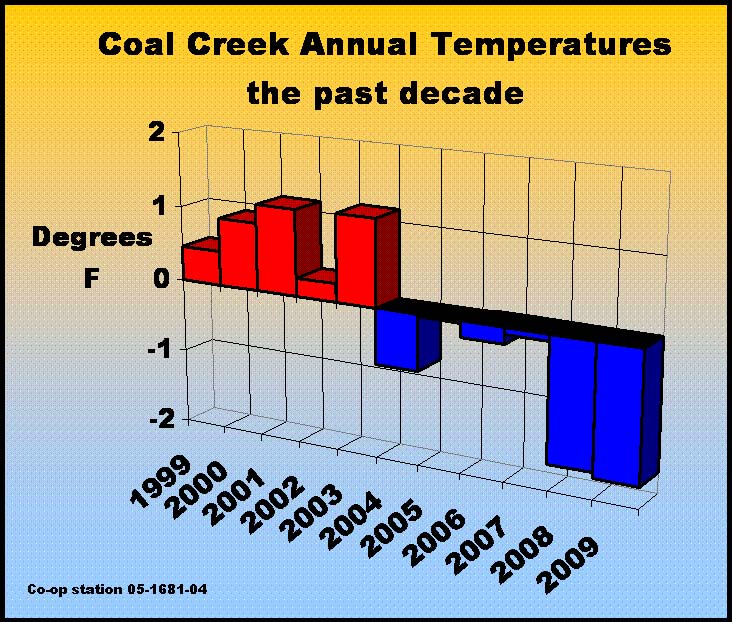
Here’s a chart of the past decade of annual temperatures (CoalCreekCO2009), updating my post from a year ago. The recent cooling trend continues, with 2009 coming in at 38.9F, colder than 2008 and a full 3 degrees F colder than 2003. The “Tipping Point” in 2003-2004 is clear on the updated graph.

The longer record at my location (CCMONTH_Hide decline anim) shows the Tipping Point more dramatically through the miracle of animation. The added trend line is from a special “best fit Hockey Stick” code I found in some downloaded e-mails last month, although I had to alter the code to change the angle of the blade.

After last January’s post, someone commented on “Watts Up With That?” that (s)he “didn’t really think [Anthony Watts] couldn’t scrape up any less significant data”. I was heartbroken with the thought that my 10,059 daily max and min temperatures could be the least significant atmospheric observations ever made. So allow me to put the record from my particular station in perspective.

The site is about 60 miles from the geographic center of Colorado, and a couple of thousand feet higher than the average elevation of the state. The aerial photo of the site (marked by the red asterisk) looks to the northwest (Coal Creek aerial). Following is a table of correlation between Coal Creek Canyon annual means and measurements of annual temperatures for the entire state of Colorado.

Correlation R between Coal Creek Canyon and:
0.92 NCDC Statewide Divisional average
0.89 GHCN and Hadley gridded temperatures (the two were so similar they were averaged together)
0.91 NCAR-NCEP Reanalysis gridded temperatures
0.95 Average of all three

These correlations are much better than those of any Bristlecones with that other Hockey Stick. Although there’s bristlecones a short hike from my house (picture - bristlecone small), I leave them alone. With a correlation R = 0.95. the Coal Creek station is pretty representative of the entire state of Colorado. Colorado, in turn, is in the Rocky Mountain and intermountain West, a region projected by the IPCC to have the greatest warming in the “lower 48” states - about 4C, or 7F, over this century (see part of IPCC fig-11-8-3). According to the IPCC models, greenhouse gas warming should be greatest over continental interiors and in the middle troposphere, so Coal Creek Canyon is an ideal “global warming” monitoring site. How, then, is the projected 0.7F per decade warming coming along?

Since 1985, the overall trend has been +0.3F per decade, about half of the IPCC projection. Since 2000, the trend has been -3F per decade - four times greater than the IPCC projection, and in the opposite direction!

This is an example of how one station’s data can be significant for assessing climate change, but only if the station is carefully installed and maintained, is in a location relatively free of non-climatic influences, has records that are diligently kept, and, above all, does not have its records mysteriously altered. It would be instructive to see records from other observers who have quality records of long duration.

Richard Keen, Ph.D.
Coal Creek Canyon, Colorado

What then about Russia? Have they been affected by CRU's influence? In part six we will look at how indeed they have.