


I recently completed a study of central Alaska's climate. For this study I computed the average annual temperature for nine long-term Alaskan stations (and station combinations), which are: Eagle/Dawson, Ft. Yukon/Central, Fairbanks University, McKinley Park, Talkeetna, Gulkana/Kennecott/Chitina/McCarthy, Yakutat, Cordova, and Valdez. Then I averaged the nine stations for a regional mean. The data source was NCDC.

The annual values on the next plot clearly show the dominance of the PDO in Alaskan climate.


 For comparison with the IPCC thumbnail for Alaska (I hope you can find an enlarged version of this), I replotted the regional temperatures as ten-year averages.
My averages show that the past three decades have shown no warming (since the PDO shift in 1977), and are in fact no warmer than the 1935-1944 decade. This is very different from the IPCC which shows a substantial warming over the past three decades. See the plot of annual versus the PDO stages.


Here is a blow up of the IPCC graph for Alaska.

My study and the GHCN use the same stations, because there are no other long-term stations in the regions. I applied no "corrections" beyond offsets used when combining two or more stations with overlapping records (no other adjustments were warranted). One can only guess what "corrections" were applied to the GHCN and IPCC data sets, but I can easily guess their magnitude - about 1 degree. Curiously, the magnitude of the adjustments is about the same as the "global warming" signal of the past century.
Dr. Richard Keen later wrote another article entitled:A Chilly December at the 700mb Level about the decline in recent temperatures in Coal Creek Canyon in Colorado, which is NW of Denver. In it he shows how this is an example of how one station’s data can be significant for assessing climate change, but only if the station is carefully installed and maintained, is in a location relatively free of non-climatic influences, has records that are diligently kept, and, above all, does not have its records mysteriously altered, as opposed to one tree from one location that fits a predetermined outcome becoming the standard for world temperature.
December was a chilly month across much of the U.S., and at my site (the NWS co-op station for Coal Creek Canyon, Colorado, NW of Denver at an elevation 8950 feet, or 720 millibars, December was the coldest December (and the coldest month of any name) in 27 years of record. The average of 16.5 was 0.8 degrees colder than December 1983. Over the entire record, nine months averaged colder than 20F; of these, five occurred during 1983-1990, none during 1991-2005, and four during 2007-2009. It appears that he warm spell of the 1990’s and early 2000’s has ended.
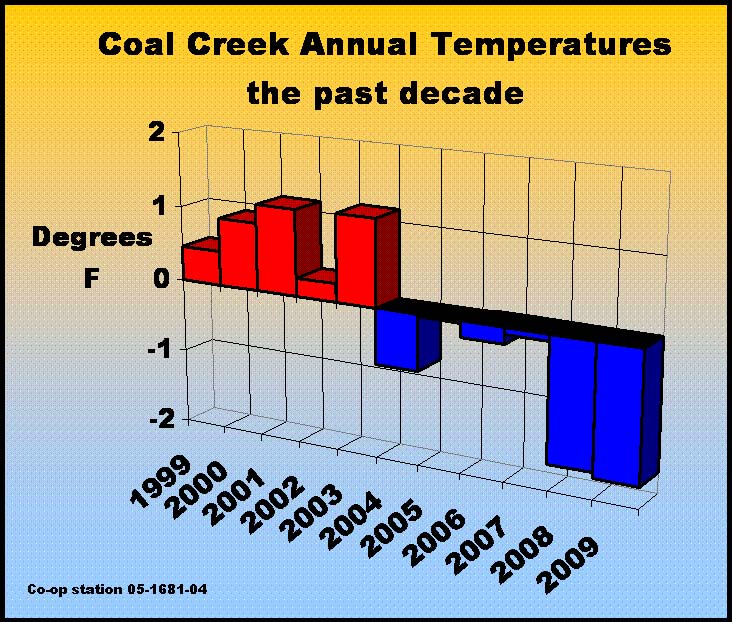
Here’s a chart of the past decade of annual temperatures (CoalCreekCO2009), updating my post from a year ago. The recent cooling trend continues, with 2009 coming in at 38.9F, colder than 2008 and a full 3 degrees F colder than 2003. The “Tipping Point” in 2003-2004 is clear on the updated graph.

The longer record at my location (CCMONTH_Hide decline anim) shows the Tipping Point more dramatically through the miracle of animation. The added trend line is from a special “best fit Hockey Stick” code I found in some downloaded e-mails last month, although I had to alter the code to change the angle of the blade.


After last January’s post, someone commented on “Watts Up With That?” that (s)he “didn’t really think [Anthony Watts] couldn’t scrape up any less significant data”. I was heartbroken with the thought that my 10,059 daily max and min temperatures could be the least significant atmospheric observations ever made. So allow me to put the record from my particular station in perspective.
The site is about 60 miles from the geographic center of Colorado, and a couple of thousand feet higher than the average elevation of the state. The aerial photo of the site (marked by the red asterisk) looks to the northwest (Coal Creek aerial). Following is a table of correlation between Coal Creek Canyon annual means and measurements of annual temperatures for the entire state of Colorado.

Correlation R between Coal Creek Canyon and:
0.92 NCDC Statewide Divisional average
0.89 GHCN and Hadley gridded temperatures (the two were so similar they were averaged together)
0.91 NCAR-NCEP Reanalysis gridded temperatures
0.95 Average of all three
These correlations are much better than those of any Bristlecones with that other Hockey Stick. Although there’s bristlecones a short hike from my house (picture - bristlecone small), I leave them alone. With a correlation R = 0.95. the Coal Creek station is pretty representative of the entire state of Colorado. Colorado, in turn, is in the Rocky Mountain and intermountain West, a region projected by the IPCC to have the greatest warming in the “lower 48” states - about 4C, or 7F, over this century (see part of IPCC fig-11-8-3). According to the IPCC models, greenhouse gas warming should be greatest over continental interiors and in the middle troposphere, so Coal Creek Canyon is an ideal “global warming” monitoring site. How, then, is the projected 0.7F per decade warming coming along?

Since 1985, the overall trend has been +0.3F per decade, about half of the IPCC projection. Since 2000, the trend has been -3F per decade - four times greater than the IPCC projection, and in the opposite direction!
This is an example of how one station’s data can be significant for assessing climate change, but only if the station is carefully installed and maintained, is in a location relatively free of non-climatic influences, has records that are diligently kept, and, above all, does not have its records mysteriously altered. It would be instructive to see records from other observers who have quality records of long duration.
Richard Keen, Ph.D.
Coal Creek Canyon, Colorado
No comments:
Post a Comment