CO2 is the main focus of the debate in global warming/climate change. The debate centres around whether the increased levels of CO2 that mankind is putting into the atmosphere have caused any of the heating between 1976 to 1998 or any changes in the worlds climate or not. The second part of the argument then revolves around will reducing the levels of man made CO2 that are put into the atmosphere have any effect on mitigating any changes in temperature and/or climate.
CO2 forms only 385 parts per million (from all sources -natural and man made) of our entire atmosphere.This means for every 1 million bits of atmosphere only 385 are CO2.
Of this small amount how much is contributed by all of mans activities? Only about 3.4% of this total. This means man as a whole is responsible for only 13.09 parts per million of CO2. Or of every 1 million bits of atmosphere 13.09 are due to mans activities the rest is due to natural sources. The following video explains this well:
So how much of this total of man's is Australia as a first world nation contributing? Only 1.5% of that total. That means that Australia as a nation is only contributing 196.35 parts per billion. Or for every 1 billion parts of atmosphere Australian's contribute only 196.35 of them.
CO2 is an odourless, colourless and naturally occurring gas. Despite the best efforts of various governments around the world to have it listed in their publics mind as one (with stock photos such as the one above shown whenever the subject is raised), it is not a pollutant. It has positive effect on the growth of plants, it is used to quell fires, to put bubbles in soft drink and beer and is breathed out by every single human and animal on the planet with every breath they take, making it a natural part of life on earth, something the activists seem to have forgotten.
The pre- mass industrial (pre 1940) levels of CO2 are said to have been approximately 280 ppm, (which is declared by some scientists as a CO2 impoverished compared with history) and have increased to approximately 380ppm in 2008.
Whilst CO2 is recognised universally as one of the greenhouse gases that make our climate temperate by trapping most of the Sun’s energy inside our atmosphere, because it is so small in quantity, it is considered only a ‘trace gas’. The largest greenhouse gas is in fact water vapour.
The following quotes contain my emphasis added.
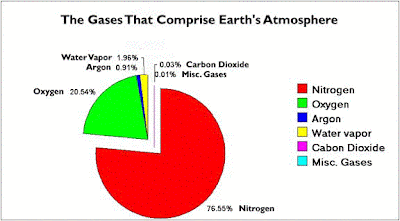
CO2 levels in the atmosphere today are NOT at record high levels. Carbon Dioxide is such a small component of Earth's atmosphere (380 ppm) that the "slice" it represents in this chart is really only a "line" about 1/2 as thick as the line shown. Compared to former geologic times, Earth's atmosphere is "CO2 impoverished.” - Monte Heib, (Professor Emeritus).
“In one of the more expensive ironies of history, the expenditure of more than $US50 billion on research into global warming since 1990 has failed to demonstrate any human-caused climate trend, let alone a dangerous one," - Professor Bob Carter (June 18, 2007.)
Air (on a dry basis) consists mainly of nitrogen 78.08% and oxygen 20.94%. Of the 0.98% remaining, 95% of that (ie 0.934%), or almost all is the inert gas argon. Carbon dioxide CO2 is a trace. It is less than 400ppm (parts per million) or 0.04% of all the atmosphere (on a dry basis). Surprisingly, less than a fifth of that is man-made CO2 (0.008% of the total), and that is only since the beginning of the industrial era and the rapid increase in world population. - Dr. Geoffrey G. Duffy, (PhD, in the Department of Chemical and Materials Engineering of the University of Auckland, NZ. )
So is 385 ppm of CO2 a large amount? In recent times yes it is, however, historically no it isn’t. As can be seen in the diagram above.
In the last 600 million years of Earth's history only the Carboniferous Period and our present age, the Quaternary Period, have witnessed CO2 levels less than 400 ppm, except during periods of glacial expansion during ice ages. Late Carboniferous to Early Permian time (315 million years ago -- 270 mya) is the only time period in the last 600 million years when both atmospheric CO2 and temperatures were as low as they are today (Quaternary Period).
There has historically been much more CO2 in our atmosphere than exists today. For example: During the Jurassic Period (200 mya), average CO2 concentrations were about 1800 ppm or about 4.7 times higher than today.
The highest concentrations of CO2 during all of the Paleozoic Era occurred during the Cambrian Period, nearly 7000 ppm -- about 18 times higher than today.
The Carboniferous Period and the Ordovician Period were the only geological periods during the Paleozoic Era when global temperatures were as low as they are today. To the consternation of global warming proponents, the Late Ordovician Period was also an Ice Age while at the same time CO2 concentrations then were nearly 12 times higher than today -- 4400 ppm.
According to greenhouse theory, Earth should have been exceedingly hot. Instead, global temperatures were no warmer than today. Clearly, other factors besides atmospheric carbon influence Earth temperatures and global warming. - Monte Heib, Professor Emeritus
Note also there is no direct link in levels of CO2 and temperature in this diagram.
But what about closer to “our time” in history what has the level of CO2 been like?
The graph above shows the recordings of CO2 in the period of 1915 to 1965. I the period between 1936 and 1949 with the exception of a couple of years after 1945 the CO2 was clearly recorded well above what we currently experience.
Yet that is the same period of time that the world was experiencing a cooling period in its temperature after a warm period that peaked in 1934.
So once again we see that there seemingly is no direct link between CO2 increase and temperature increase.
Yet recently the renown climate alarmist and activist Dr. James Hansen of NASA GISS made a statement to the effect of: “ the maximum safe level of carbon dioxide in the atmosphere is 350 ppm.”
A level we have exceeded on several occasions already, yet life goes on.
One of the most important indicators of whether CO2 is the culprit was examined by Dr David Evans (who has six University degrees including a PhD from Stanford University) who worked for the Australian Greenhouse Office from 1999 to 2005. What he found convinced him that CO2 was not the cause of the worlds warming up to 1998 and made him change sides to the sceptics is as follows:
Greenhouse Signature Missing - August 2007.
Each possible cause of global warming causes the atmosphere to warm at different latitudes and altitudes — that is, each cause will produces a distinct pattern of hot spots in the atmosphere, or “signature”. The greenhouse signature is very distinct from the others: warming due to greenhouse would cause most warming in the tropics at about 10 km up in the atmosphere:
The figure above shows Greenhouse Signatures from the IPCC Assessment Report Number 4, 2007, Appendix C.
As of August 2007, we’ve measured where the warming is occurring using satellites and radiosondes (weather balloons). The observed signature is nothing like the greenhouse signature — the distinct greenhouse signature is entirely missing:
The figure above is the observed warming (US CCSP 2006 p.116 fig. 5.7, confirmed by more measurements published in 2007).
There is no hotspot in the tropics at 10 km up, so now we know that greenhouse warming is not the (main) cause of global warming — so we know that carbon emissions are not the (main) cause of global warming.
Of course, these observations need to be repeated by other researchers before we can be completely sure, but they are made by top-notch researchers and reported in top-of the-line peer-reviewed journals so at this stage they look solid. Recent radiosondes have confirmed the results so far. - Dr David Evans (11 December 2007).
Then later:
When the signature was found to be missing in 2007 (after the latest IPCC report), alarmists objected that maybe the readings of the radiosonde thermometers might not be accurate and maybe the hot spot was there but had gone undetected. Yet hundreds of radiosondes have given the same answer, so statistically it is not possible to have missed the hot spot. (18 Jul 08)
Recently in a deliberately calculated piece of political spin designed to convince the public to support their Emission Trading Schemes, CO2 has been referred to as a pollutant in both Australia and the United States. The Rudd government in Australia now refers to their Emissions Trading Scheme as a Carbon Pollution Reduction Scheme.
Minister for Climate Change Penny Wong wrote a paper entitled “Why we need to act” in July 2008 in which she stated: “Carbon pollution is causing climate change, resulting in higher temperatures, more droughts, rising sea levels and more extreme weather.”
President elect of the USA, Barack Obama declared in early October 2008 as part of his election campaign that he would declare CO2 “a dangerous pollutant” if he won office in the November 2008 elections.
President elect of the USA, Barack Obama declared in early October 2008 as part of his election campaign that he would declare CO2 “a dangerous pollutant” if he won office in the November 2008 elections.
He did win and on April 17, 2009 the U.S. - E.P.A. signed the Proposed Endangerment and Cause or Contribute Findings for Greenhouse Gases under the Clean Air Act. The Administrator signed a proposal that proposed: that the current and projected concentrations of the mix of six key greenhouse gases—carbon dioxide (CO2), methane (CH4), nitrous oxide (N2O), hydrofluorocarbons (HFCs), perfluorocarbons (PFCs), and sulfur hexafluoride (SF6)—in the atmosphere threaten the public health and welfare of current and future generations. This is referred to as the endangerment finding.
So now the gas that puts bubbles in beer and soft-drink and is used by market gardeners to grow their crops in greenhouses (seen above) is to be declared a poison.
But are they right or are they just playing politics so as is suggested in many articles written by sceptics “ to be seen as the saviours of the planet”?


That E&E paper is absolute rubbish...
ReplyDeleteFirstly E&E is NOT a scientific journal and a shonky peer review process.
And secondly, if you have a look at CO2 prior to 1950 it acts irradically and then there is a stable increase from 1950 to now.
What is up with that? It is obviously rubbish
"Your comment will be visible after approval."
ReplyDeleteI'm guessing you're going to disapprove it.
Rubbish
Lenny, firstly thank you for taking the time to write a comment, as you can see it has been published. Unlike many "warmist" sites like "Real Climate" (who regularly edit out dissent), I accept that there are differing opinions out there and providing they aren't abusive will publish them.
ReplyDeleteYou raised in your comment the issue of shonky peer review processes, yet I am assuming you are accepting of those used by members of GISS, CRU and Real Climate blog as being ok.
As the Climategate emails exposed, those people were only peer reviewing through a closed clique of publishing journals, reviewer mates and a total shut out once again of any contrary opinion or science by this cabal. This was a deliberate act on their part as Dr. Phil Jones said: "Even if we have to redefine what the peer-review literature is !" In relation to shutting out comments by Chris de Freitas and Roger Pielke (sr?). If this manipulation and corruption of the process isn't "shonky peer review" on which to base your opinion then I'm not sure what is.